Figures & data
Table 1 Characteristics of the patients’ cohort
Figure 1 GPR91 is a specific target of miR-326. (A) qPCR detection of the mRNA expression levels of molecules in the GPR91/STAT3/VEGF signaling pathway in different tissues. **P<0.01 vs normal endometrium; t test; n=6. (B) Western blotting analysis of the protein expression levels of molecules in the GPR91/STAT3/VEGF signaling pathway in different tissues. E, Endometrium carcinoma; N, Normal endometrium. (C) Bioinformatic analyses predicted GPR91 (SUCNR1) as one of the specific target genes of miR-326. (D) Luciferase reporter assay results suggesting that miR-326 silences the expression of GPR91 by binding to a specific site on the 3′ UTR of GPR91. *P<0.05 vs pcDNA; t test; n=6. (E) Northern blotting results showing that the hybridization signal of miR-326 is significantly lower in endometrial carcinoma tissues compared with that in normal tissues. **P<0.01 vs normal endometrium; t test; n=3. (F) qPCR results showing that miR-326 is significantly downregulated in endometrial carcinoma tissues. **P<0.01 vs normal endometrium; t test; n=6.
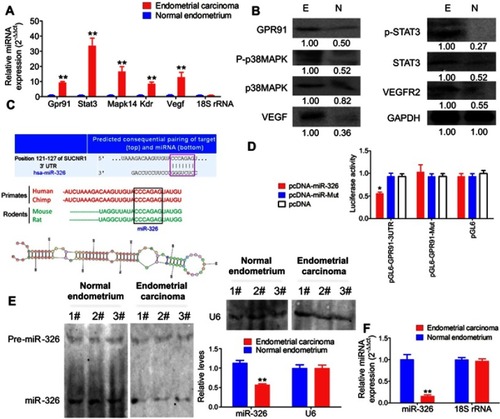
Figure 2 SPIONs can accumulate in HuECSCs. (A) Transmission electron microscopy of SPIONs. (B) Particle size of the SPION core. (C) Hysteresis loop of a SPION. (D) Experimental procedures for loading pcDNA-miR-326 onto SPIONs (miR-326@SPION); (F) Transmission electron microscopy showing that large quantities of SPIONs are aggregated in microvesicles within the cytoplasm of HuECSCs. Scale bar =250 nm.
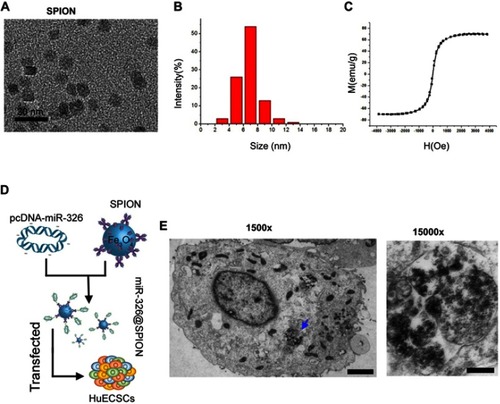
Figure 3 miR-326@SPION significantly inhibits the proliferation, invasion, and angiogenesis of HuECSCs in vitro. (A) MTT assay results suggesting that miR-326@SPION significantly inhibits the proliferation of HuECSCs in vitro. **P<0.01 vs miR-mut@SPION; t test; n=3. (B) Flow cytometry analyses suggesting that miR-326@SPION significantly inhibits cell cycle progression of HuECSCs. *P<0.05 vs miR-mut@SPION; t test; n=3. (C) Transwell chamber cell invasion assay showing that miR-326@SPION significantly inhibits the invasion of HuECSCs in the extracellular matrix. **P<0.01 vs miR-mut@SPION; t test; n=3. Scale bar =30 μm. (D) miR-326@SPION significantly inhibits the angiogenic capacity of HUVECs in the extracellular matrix. **P<0.01 vs miR-mut@SPION; t test; n=3. Scale bar =30 μm.
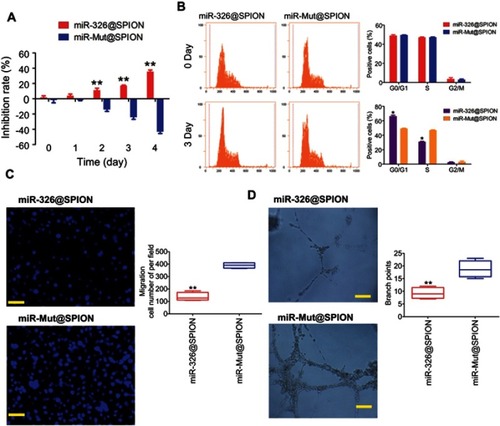
Figure 4 miR-326@SPION significantly inhibits the tumorigenicity of HuECSCs in nude mice. (A) Tumours derived from each group of HuECSCs on the back of nude mice. An arrow indicates the tumour tissue. (B) Results of MRI scans in each group of tumour-bearing mice. A dashed lines indicated the tumour tissue. (C) The tumours derived from miR-326@SPION-HuECSCs in nude mice are significantly smaller in terms of volume and weight compared with tumours derived from miR-mut@SPION-HuECSCs. **P<0.01 vs miR-mut@SPION; t test; n=6. (D) Transmission electron microscopy revealing the presence of high-density electron clouds resulting from the aggregation of circular particles in the xenograft tumours derived from both cell groups. Scale bar =250 nm. (E) The pathological examination results from H&E staining of the tumour sections showing that the tumours derived from both groups of cells display the pathological features of type II EC. Scale bar =30 μm. (F) Immunohistochemical staining results indicating that the percentage of Ki67-positive cells in tumours derived from miR-326@SPION-HuECSCs is significantly lower than that derived from miR-mut@SPION-HuECSCs. Scale bar =30 μm.
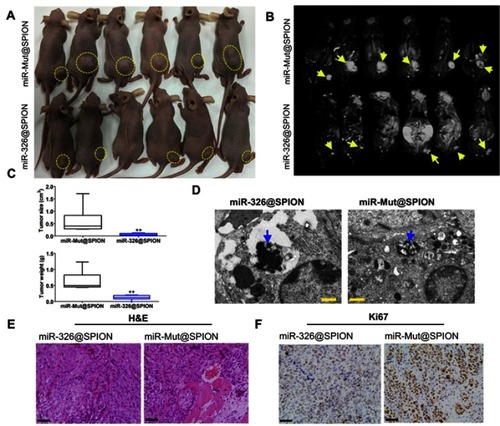
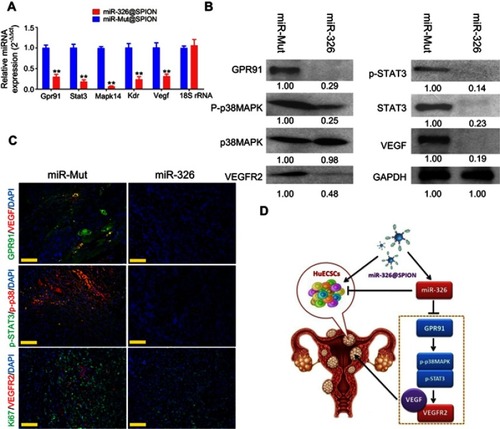
Figure 5 miR-326 significantly inhibits the expression of the GPR91/STAT3/VEGF signaling pathway in HuECSCs. (A) qPCR detection of the mRNA expression levels of molecules in the GPR91/STAT3/VEGF signaling pathway in each group of cells. **P<0.01 vs miR-mut@SPION; t-test; n=3. (B) Western blotting analysis of the protein expression levels of molecules in the GPR91/STAT3/VEGF signaling pathway in each group of cells. (C) Immunofluorescence staining was used to identify the protein expression levels of molecules in the GPR91/STAT3/VEGF signaling pathway in the tumour tissue sections of each group. Scale bar =30 μm. (D) The molecular mechanism of miR-326@SPION in targeting the GPR91/STAT3/VEGF signaling pathway.