Figures & data
Figure 1 Schematic diagram of self-assembled TA6NT-AKTin-DOX. TA6NT-AKTin-DOX consists of a CD44 aptamer TA6, DNA building blocks M1 and M2 conjugated by an AKT inhibitor peptide AKTin individually, and DOX. This aptamer-conjugated DNA nanotrain was first taken up via targeted endocytosis. Following the release in acidic organelles, DOX diffused into the cell nucleus and the AKTin inhibited AKT. Drug resistance reversal can be achieved by interfering ABCG2-mediated drug efflux and inducing apoptosis.
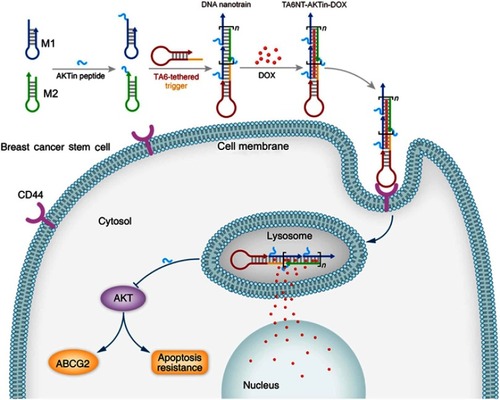
Figure 2 Construction and characterization of TA6NT-AKTin-DOX. (A) Agarose gel electrophoresis showing the effect of TA6-tethered trigger concentration on HCR amplification. Lanes 1–5: five different concentrations of TA6-tethered trigger (0.00, 0.10, 0.20, 0.33 and 1.00 μM) in a 1 μM mixture of M1-AKTin and M2-AKTin. Lane 6: DL2000 DNA marker. (B) Fluorescence spectra of DOX (1 μM) with increasing equivalents of TA6NT-AKTin, at DOX/TA6NT-AKTin molar ratios of 320, 160, 80, 40, 20, 0 and DOX only, respectively. The fluorescence quenching indicates DOX loading into TA6NT-AKTin. (C) In vitro release profiles of DOX at pH 7.4 containing 10% FBS, pH 7.4, 5.0 and 5.0 with DNase II. Data are mean±SD (n=3). (D) Agarose gel electrophoresis of TA6NT-AKTin-DOX at pH 7.4 containing 10% FBS, pH 7.4, 5.0 and 5.0 with DNase II for 24 hrs. (E) Fluorescence images of BCSCs treated with both LysoTracker Green and TA6NT-AKTin-DOX.
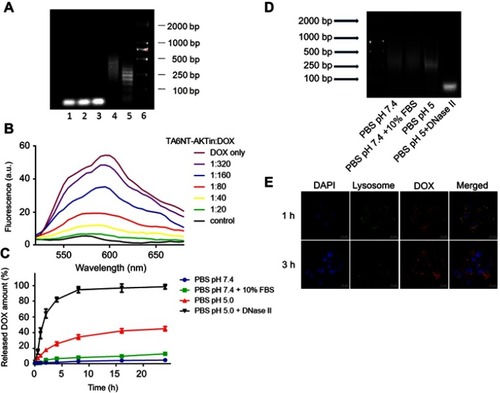
Figure 3 (A) Quantification of the ability to regenerate mammosphere of BCSCs after treating 2 µM DOX and TA6NT-AKTin-DOX for 12 hrs. (B) Cytotoxicity profiles of free DOX, TA6NT-DOX, TA6NT-AKTin together with DOX and TA6NT-AKTin-DOX for BCSCs (n=3). (C) Cellular apoptosis of BCSCs detected using TUNEL assay. Nuclei were stained with DAPI, and merged images were considered as apoptotic cells. (D) Fluorescence images of BCSCs and NIH-3T3 cells after the treatment of 2 µM free DOX, NT-AKTin-DOX and TA6NT-AKTin-DOX for 12 hrs, and (E) the measured DOX amounts in the whole cell and nucleus isolated from BCSCs (n=3). Two-tailed Student’s t-test was used. *p<0.05, **p<0.01.
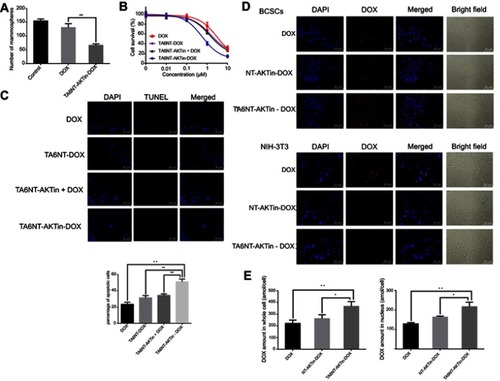
Figure 4 Western blotting of p-AKT, AKT, ABCG2 and cleaved caspase-3 in BCSCs with the treatment of DOX and TA6NT-AKTin-DOX.
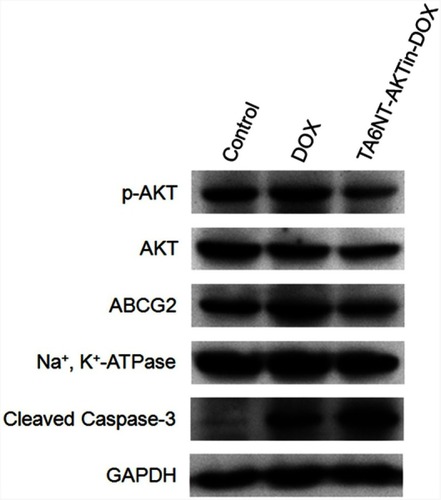
Figure 5 (A) Tumor volume change, (B) tumor weight on day 25, (C) excised tumor and (D) body weight change of mice bearing BCSCs xenografts after the treatment of free DOX, TA6NT-DOX, TA6NT-AKTin together with DOX, TA6NT-AKTin-DOX and saline. *p<0.05, **p<0.01. (E) The result of CBC testing.
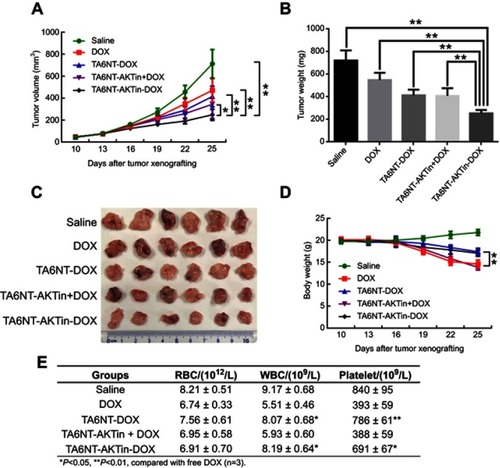
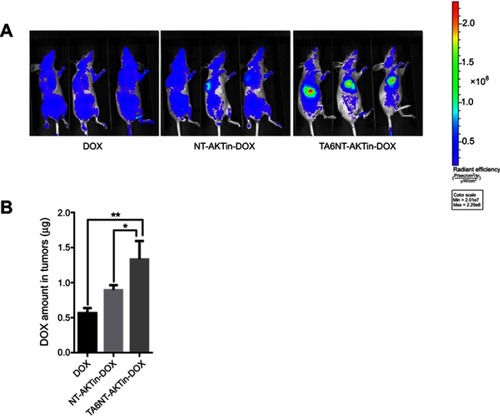
Figure 6 (A) In vivo images of mice treated with 5 mg DOX equivalent/kg of free DOX, NT-AKTin-DOX and TA6NT-AKTin-DOX for 4 hrs. (B) The measured DOX amounts in tumors. Two-tailed Student’s t-test was used. *p<0.05, **p<0.01.