Figures & data
Figure 1 The structures of CDots used in the study and the illustration of CDot’s antibacterial action. (A) A cartoon illustration on CDots of different surface functionalities. Left: EDA-CDots and EPA-CDots prepared by functionalization in amidation reactions. Right: Chemical structures of PEI and PEI/CA zwitterionic pairs that likely dominate the surface passivation layers of their corresponding CDots. (B) A cartoon illustration of CDots’ photoactivated antibacterial activity to bacteria.
Abbreviations: CDots, carbon dots; EDA, 2,2-(ethylenedioxy)bis(ethylamine); EPA, ethoxypropylamine; PEI, polyethylenimine.
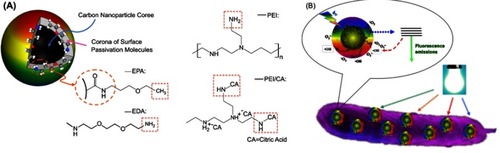
Table 1 Relevant characteristics of EDA-CDots and EPA-CDots
Figure 2 The antibacterial activity of EDA-CDots and EPA-CDots. Viable cell reductions in B. subtilis cells by the treatments of EDA-CDots and EPA-CDots at 0.1 and 0.2 mg/mL with light illumination for 1 hr. Statistical analysis was performed on the results of each CDots concentration (0.1 and 0.2 mg/mL) respectively. Different letters above the bars indicate statistical difference between the results (P<0.05); identical letters above the bars indicate no statistical difference.
Abbreviations: EDA, 2,2-(ethylenedioxy)bis(ethylamine); CDots, carbon dots; EPA, ethoxypropylamine.
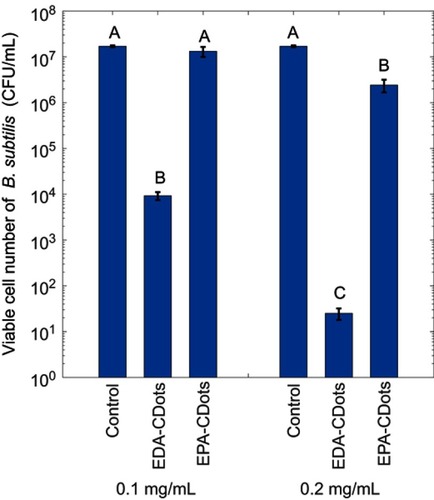
Table 2 Relevant characteristics of PEI-CDots and PEI/CA-CDots
Figure 3 The antibacterial activity of PEI-CDots and PEI/CA-CDots-1. Viable cell reductions in B. subtilis cells by the treatments of PEI-CDots and PEI/CA-CDots-1 at two concentrations with light illumination for 1 hr. Statistical analysis was performed on the results of each CDots concentration (0.1 mg/mL and 0.2 mg/mL) respectively.
Notes: Statistical analysis results are indicated by the letters on the bars. Different letters above the bars indicate statistical difference between the results (P<0.05); identical letters above the bars indicate no statistical difference.
Abbreviations: PEI, polyethylenimine; CDots, carbon dots; CA, citric acid.
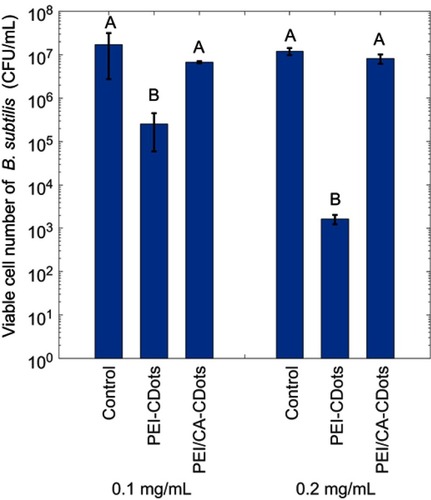
Table 3 Relevant characteristics of the serial of PEI/CA-CDots
Figure 4 The antibacterial activity of a serial of PEI/CA-CDots. Viable cell reductions in B. subtilis cells by 1 hr treatments with the PEI/CA-CDots-1, −2, and −3 of different surfaces –NH2 populations all at a dot concentration of 0.1 mg/mL with light illumination.
Notes: Statistical analysis results are indicated by the letters on the bars. Different letters above the bars indicate statistical difference between the results (P<0.05); identical letters above the bars indicate no statistical difference.
Abbreviations: PEI, polyethylenimine; CDots, carbon dots; CA, citric acid.
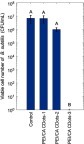
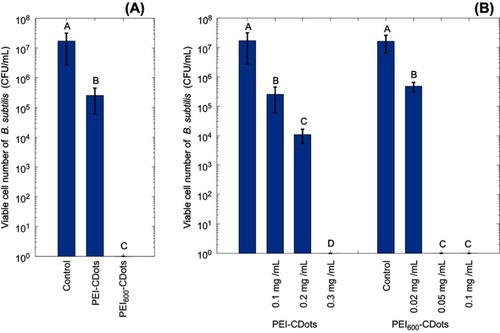
Figure 5 The antibacterial activity of PEI-CDots with different PEI molecular weight. (A) Viable cell reductions in B. subtilis cells by 1 hr treatment with PEI-CDots and PEI600-CDots at 0.1 mg/mL with light illumination. (B) Viable cell reductions in B. subtilis cells by 1 hr treatment under visible light illumination with PEI-CDots at concentrations ranging from 0.1 to 0.3 mg/mL, and PEI600-CDots at concentrations ranging from 0.02 to 0.1 mg/mL.
Notes: Statistical analysis results are indicated by the letters on the bars. Different letters above the bars indicate statistical difference between the results (P<0.05); identical letters above the bars indicate no statistical difference. In Figure 5B, statistical analysis was performed on the results of each type of CDots (PEI-CDots and PEI600-CDots) respectively.
Abbreviations: PEI, polyethylenimine; CDots, carbon dots.