Figures & data
Figure 1 . Synthesis of the Tp-AgNPs using the endophytic fungi extracts and their characterization by UV-visible spectrophotometer (A), FTIR analysis (B), Particle size analysis (C), XRD pattern analysis (D).
Abbreviations: FTIR, Fourier transform infrared spectroscopy; XRD, X-ray diffraction; Tp-AgNPs, Talaromyces purpureogenus silver nanoparticles.
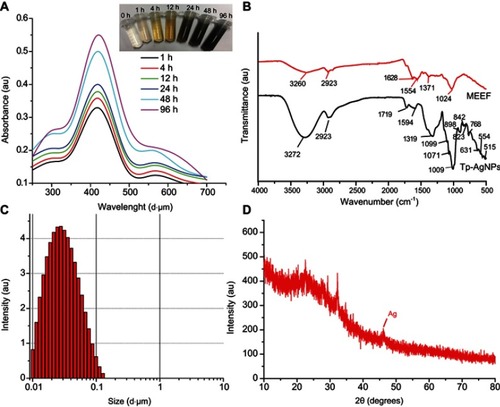
Figure 2 FETEM image of Tp-AgNPs at <100 nm (A) and 20 nm (B). EDS-based mapping of the Ag (C) and carbon in Tp-AgNPs (D). EDS chromatograph of Tp-AgNPs (E).
Abbreviations: FETEM, field emission transmission electron microscopy; Tp-AgNPs, Talaromyces purpureogenus silver nanoparticles; EDS, energy-dispersive X-ray spectroscopy; Ag, silver.
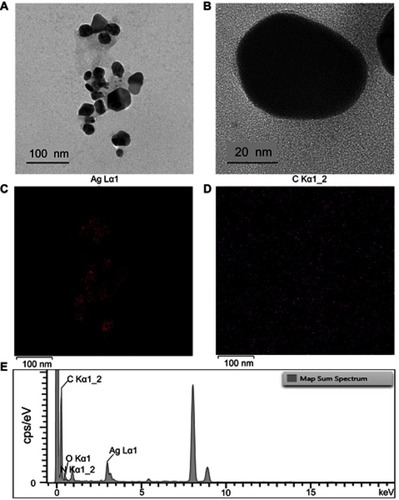
Figure 3 Cytotoxicity of Tp-AgNPs and AgNO3 in A549 cells (A). Flow cytometry-based analysis of cell death in A549 cells untreated (B) and treated with Tp-AgNPs (C) and analysis of the ROS generation in A549 cells untreated (E) and treated with Tp-AgNPs (D).
Abbreviations: CK, control group; Tp-AgNPs, Talaromyces purpureogenus silver nanoparticles; AgNO3, silver nitrate; ROS, reactive oxygen species.
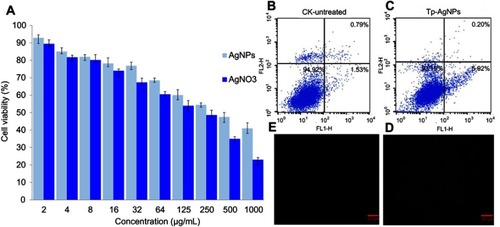
Table 1 Antibacterial activity of silver nanoparticles (AgNPs) synthesized by endophytic fungi
Table 2 Zone of inhibition of produced by Tp-AgNPs synthesized from endophytic fungi Talaromyces purpureogenus against bacterial pathogens
Figure 4 Antibactrial activity of Tp-AgNPs: Staphylococcus aureus (A), Bcillus cereus (B), Salmonella entrica (C), Pseudomonas aeruginosa (D), and Escherichia coli (E). Ab – vancomycin; different concentrations of Tp-AgNPs solution: 25–100 µg mL−1.
Abbreviations: Tp-AgNPs, Talaromyces purpureogenus silver nanoparticles; Ab, vancomycin.
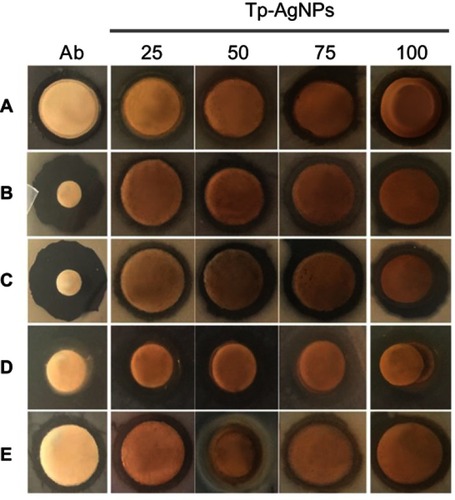
Table 3 Cell wound healing efficiency of Tp-AgNPs
Figure 5 Wound healing effect of the Tp-AgNPs in NIH3T3 cells at different time intervals.
Abbreviations: CK, control group; Tp-AgNPs, Talaromyces purpureogenus silver nanoparticles; NIH3T3, Swiss albino mouse embryo tissue.
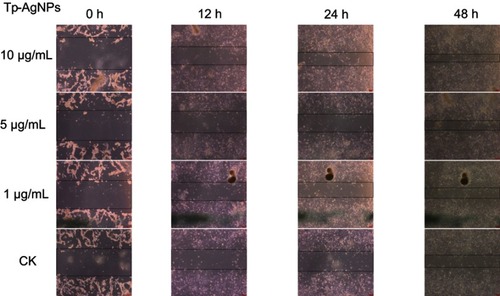
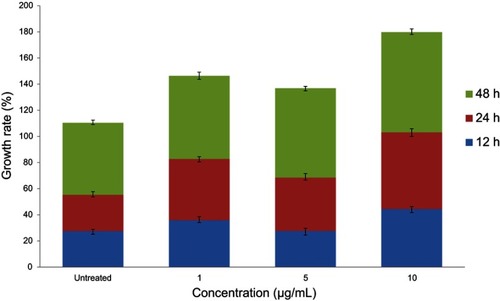
Figure 6 The growth rate of wound healing effort of the Tp-AgNPs in NIH3T3 cells at different time intervals.
Abbreviations: Tp-AgNPs, Talaromyces purpureogenus silver nanoparticles; NIH3T3, Swiss albino mouse embryo tissue.