Figures & data
Figure 1 (A) Schematic illustration of preparation of the curcumin–phospholipid complex and IR780-loaded self-microemulsifying drug delivery systems. (B) FTIR spectra of curcumin (CUR), phospholipid (PC), physical mixture of CUR and PC (CUR-PC physical mixture), and CUR-PC complex. (C) Chemical structures of CUR and IR780. (D) Droplet size of CUR/IR780@SMEDDS. Insert: TEM image of CUR/IR780@SMEDDS (upper panel) and photograph of blank SMEDDS, CUR@SMEDDS, and CUR/IR780@SMEDDS (lower panel). (E) Fluorescence emission spectra of CUR in the presence of different IR780 concentrations. (F) Fluorescence emission spectra of IR780 in the presence of different CUR concentrations. (G) UV-Vis absorption spectra of CUR, phospholipids, IR780, and CUR/IR780@SMEDDS.
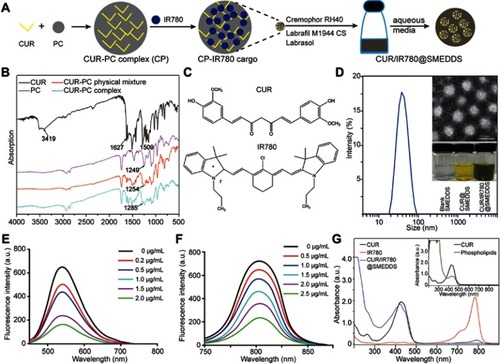
Figure 2 In vitro release profiles of curcumin (CUR) (A) and IR780 (B) in PBS (pH 6.8). (C–D) In vitro photothermal behavior of CUR/IR780@SMEDDS: (C) temperature change curves of CUR/IR780@SMEDDS containing different concentrations of IR780 after NIR irradiation (808 nm, 0.8 W/cm2). CUR@SMEDDS and deionized water were used as control. (D) IR thermal images of deionized water and CUR/IR780@SMEDDS during 5-min laser irradiation. Data are represented as means±SD (n=3).
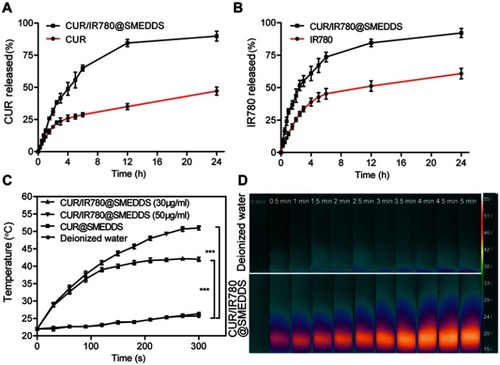
Figure 3 Confocal images of cellular uptake for CUR/IR780@SMEDDS in Caco-2 cells and 4T1 cells.
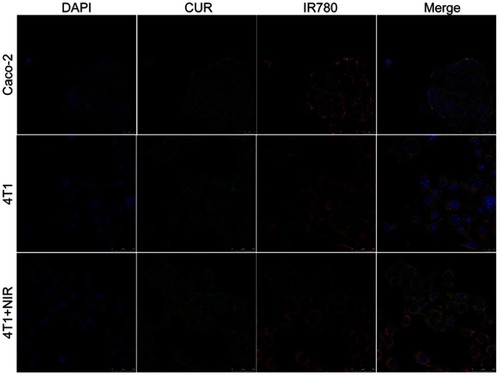
Figure 4 (A) Confocal images of ROS generation by CUR/IR780@SMEDDS after NIR irradiation (808 nm, 0.8 W/cm2, 5 mins) in 4T1 cells. (B) Quantitative analysis of ROS generation by PBS (control), CUR/IR780@SMEDDS, and CUR/IR780@SMEDDS after NIR irradiation (808 nm, 0.8 W/cm2, 5 mins) in 4T1 cells. (C) In vitro cellular uptake of control, CUR/IR780@SMEDDS, and CUR/IR780@SMEDDS+NIR. ** p<0.01. (D) Cell viability of 4T1 cells incubated with IR780, CUR@SMEDDS, CUR/IR780@SMEDDS, IR780+NIR (808 nm, 0.8 W/cm2, 5 mins), and CUR/IR780@SMEDDS+NIR. (E) Quantitative analysis in 4T1 cells: (a) wound healing assay, (b) transwell migration assay, and (c) invasion assay. Photographs of the transwell migration assay (F) and invasion assay (G) with 4T1 cells treated with control, IR780, CUR@SMEDDS, CUR/IR780@SMEDDS, control+NIR, IR780+NIR, and CUR/IR780@SMEDDS+NIR. Data are represented as means±SD (n=5).
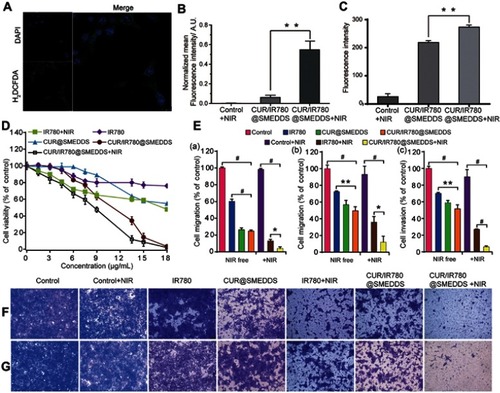
Table 1 Pharmacokinetic parameters of curcumin (CUR) and IR780 after oral administration of CUR/IR780@SMEDDS, CUR suspensions, or IR780 suspensions in rats (n=5). Data are expressed as mean±SD.
Figure 5 In vivo bioavailability and distribution study. (A) Plasma concentration-time curve of curcumin (CUR) in rats after oral administration of CUR suspensions and CUR/IR780@SMEDDS. (B) Plasma concentration-time curve of IR780 in rats after oral administration of IR780 suspensions and CUR/IR780@SMEDDS. Data are represented as means±SD (n=5). (C) Representative fluorescence images of rats treated with IR780 dispersions and CUR/IR780@SMEDDS at predetermined time points. (D) Representative fluorescence images of isolated tumors and organs, including the gastrointestinal tract.
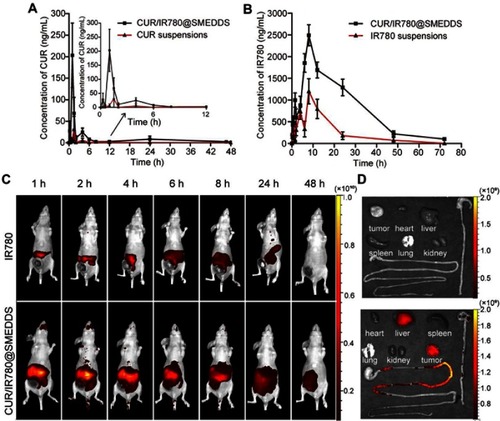
Figure 6 In vivo antitumor effects. (A) Photothermal images of 4T1 tumor-bearing nude mice treated with PBS, IR780, and CUR/IR780@SMEDDS under NIR laser irradiation. (B) Tumor temperature-time curve after NIR irradiation (n=3). (C) Photographs of tumors and 4T1 tumor-bearing nude mice treated with control, IR780, CUR, IR780+NIR, CUR/IR780@SMEDDS, CUR@SMEDDS, and CUR/IR780@SMEDDS+NIR 16 days after administration. (D) (a) Tumor volume in nude mice treated with control, IR780, CUR, CUR@SMEDDS, CUR/IR780@SMEDDS, IR780+NIR, and CUR/IR780@SMEDDS+NIR; **p<0.01. (b) Body weight change of tumor-bearing mice. Data are represented as mean±SD (n=7).
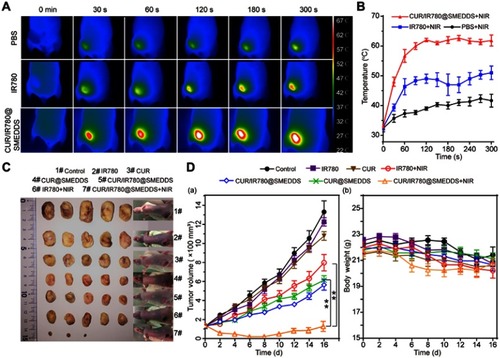
Figure 7 (A) Histological examination (scale 200 μm) and (B) TUNEL analysis of tumor tissues treated with control, IR780, CUR, CUR@SMEDDS, CUR/IR780@SMEDDS, IR780+NIR, and CUR/IR780@SMEDDS+NIR 16 days after administration. “Surface” and “Deep” labeled rows represent H&E images of superficial and deep tumor tissue regions, respectively. (a) TUNEL assay images and (b) quantitative analysis of fluorescence intensity in apoptotic cells (mean±SD, n=5).
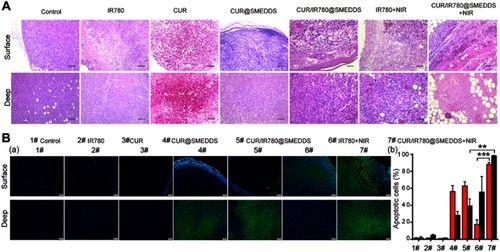
Figure 8 (A) Photographs and (B) histological examination of pulmonary metastatic nodules in nude mice treated with control, IR780, CUR, CUR@SMEDDS, CUR/IR780@SMEDDS, IR780+NIR, and CUR/IR780@SMEDDS+NIR. (C) Number of pulmonary metastatic nodules in nude mice after treatments. (D) Pulmonary metastatic area of nude mice after treatments. Data are represented as mean±SD of five animals. ** p<0.01.
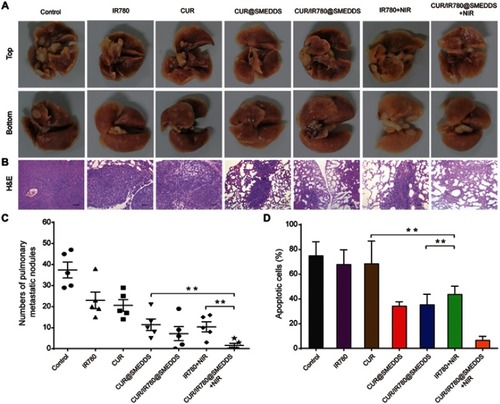
Figure 9 (A) Histological examination of stomach, jejunum, and ileum. (B) (a) Hematological and (b) biochemical parameters of liver and kidney function in mice treated with control and CUR/IR780@SMEDDS (means±SD, n=5).
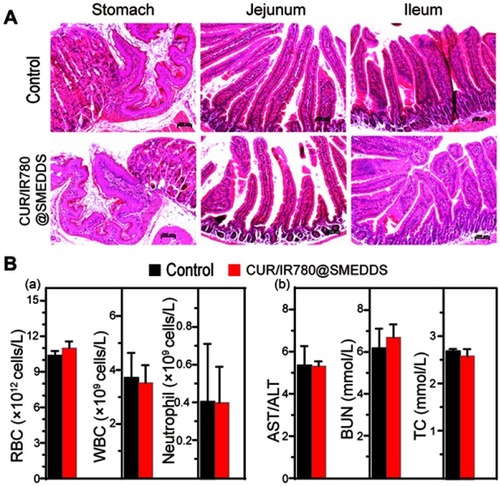
Figure S1 FTIR spectra of (A) Raw IR780, (B) PC, (C) physical mixture of IR780 and PC, and (D) IR780 PC formed by the phospholipid complex preparing process.
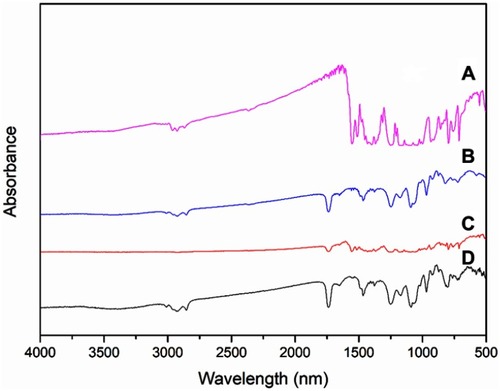
Figure S2 Confocal images of ROS generation by control under NIR irradiation (808 nm, 0.8 W/cm2, 5 mins) and CUR@SMEDDS in 4T1 cells.
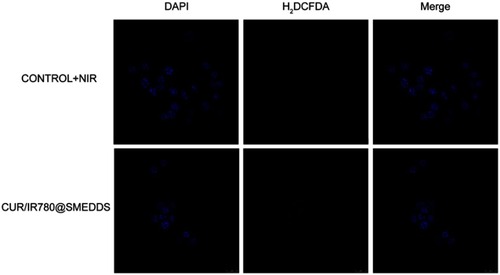
Figure S3 Confocal images of cellular uptake for CUR/IR780@SMEDDS in Caco-2 cells.
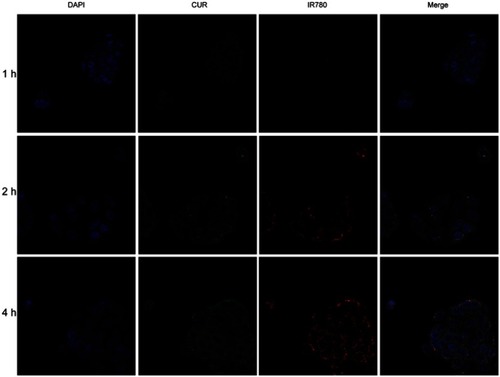
Figure S4 Confocal images of cellular uptake for CUR/IR780@SMEDDS in (A) 4T1 cells and (B) 4T1 cells under NIR irridiation (808 nm, 0.8 W/cm2, 5 mins).
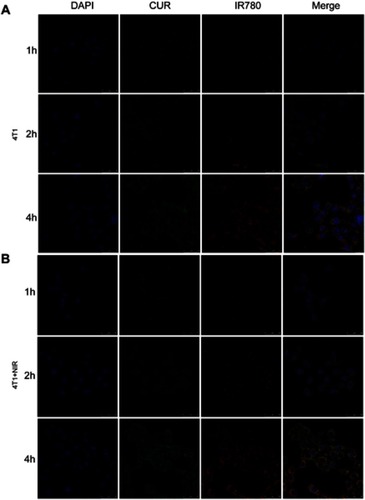
Figure S5 Photographs of the wound healing assay with 4T1 cells treated with control, IR780, CUR@SMEDDS, CUR/IR780@SMEDDS, control+NIR, IR780+NIR, and CUR/IR780@SMEDDS+NIR.
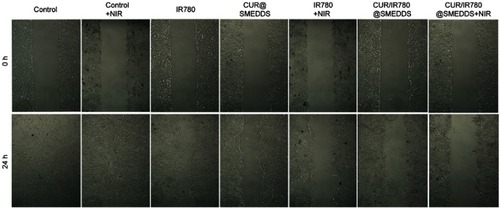
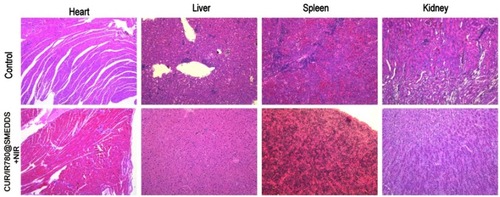
Figure S6 Histological examination of heart, liver, spleen, and kidney in tumor-bearing nude mice treated with control and CUR/IR780@SMEDDS+NIR.