Figures & data
Figure 1 A schematic diagram showing the step-by-step preparation method (nano-precipitation) of the PLGA-ORM nanoformulation.
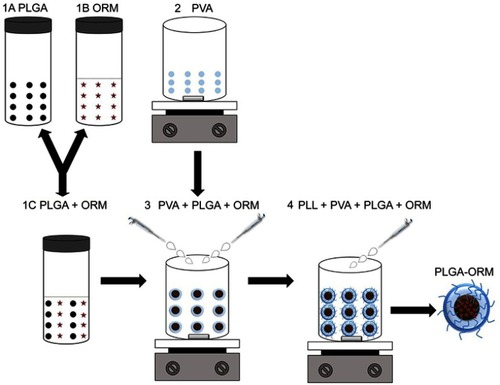
Figure 2 Physicochemical characterization of PLGA-ORM. (A) Table shows particle size (measured by DLS), drug loading, and encapsulation efficiency. (B) TEM image shows particle size of PLGA-ORM. Image was taken at 600,000× (C) FT-IR and (D) DSC spectra of free ORM and PLGA-ORM. (E) Whole human serum stability profile of PLGA-ORM for 48 hrs.
Abbreviations: DLS, dynamic light scattering; DSC, differential scanning calorimeter; ORM, ormeloxifene.
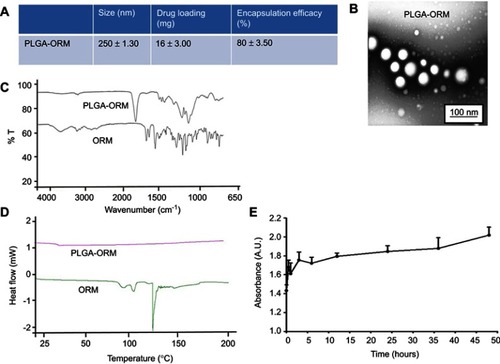
Figure 3 Hemocompatibility (Hemolysis) of PLGA-ORM with human RBCs. (A) Optical images of the supernatant. Human RBCs were treated with PLGA-ORM at different concentrations for 2 hrs at 37°C and centrifuged at 1000 rpm for 5 mins. Supernatant was collected in a 96-well plate and imaged with CamScanner mobile app. (B) Absorbance (optical density) of the supernatant. Supernatant containing wells were measured at 570 nm. SDS and PBS were used as positive and negative controls, respectively. Results were normalized to SDS. Error bars show SEM, n=3. *p<0.05. (C) Phase contrast images of RBCs. After 2 hrs of treatment, a drop of RBCs was placed on a glass slide, covered with coverslip and imaged with a phase contrast microscope. Images shown only at the highest concentration used (500 µM). Images were taken at 200×.
Abbreviations: ORM, ormeloxifene; RBCs, red blood cells.
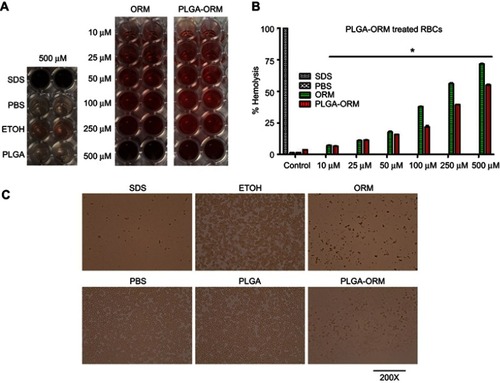
Figure 4 Cellular uptake and uptake mechanism of PLGA-ORM. (A) Qualitative representation of cellular uptake. Caski and SiHa cells were treated with coumarin-6-loaded PLGA-ORM nanoparticles for 1 hr. Cells indicated an increased uptake in a dose-dependent manner. Images were taken at 200×. (B) Quantitative measurement of PLGA-ORM uptake. Coumarin-6-loaded PLGA-ORM internalization in Caski and SiHa cell lines increased in a dose-dependent manner. Results were normalized to the PLGA control particles. Error bars show SEM, n=3. *p<0.05. (C) Internalization of coumarin-6-loaded PLGA-ORM is energy-dependent. Cells were treated with PLGA-ORM C6 and incubated at different temperatures. Cells showed blocked or inhibited uptake of particles when incubated at 4°C. Results were normalized to the particles incubated at 37°C. Error bars show SEM, n=3. *p<0.05.
Abbreviation: ORM, ormeloxifene.
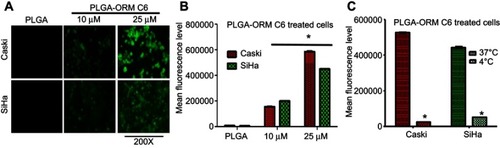
Figure 5 Internalization mechanism of PLGA-ORM nanoparticles in cervical cancer cells. (A) Caski and (B) SiHa cell lines were treated with different endocytosis pathway inhibitors and PLGA-ORM C6 for 1 hr each. Cellular uptake of PLGA-ORM was decreased with multiple inhibitors’ treatment as confirmed by flow cytometer. Results were normalized to PLGA-ORM C6 particles. Error bars show SEM, n=3. *p<0.05. (C) Caski and (D) SiHa confocal images also showing that PLGA-ORM C6 internalized in cells through multiple endocytosis pathways after 1 hr treatment. Experiments were performed in the presence of endocytosis inhibitors. Images were taken at 200×. (E) A schematic showing internalization of PLGA-ORM nanoparticles in cells using endocytosis pathway.
Abbreviation: ORM, ormeloxifene.
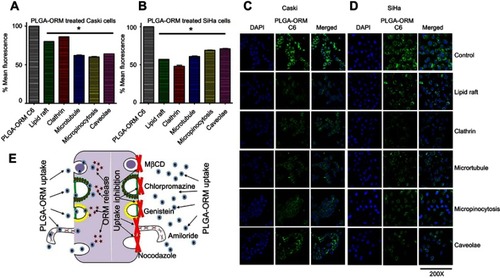
Figure 6 PLGA-ORM decreased cell proliferation and mitochondrial membrane potential of cells. Cell proliferation. (A) Caski and (B) SiHa cell lines were treated with ORM and PLGA-ORM (10, 20 and 25 µM) for 48 hrs. MTS method was used to determine proliferation and absorbance was measured at 490 nm. Results were normalized to the vehicle controls (ETOH and PLGA) and free ORM. Error bars show SEM, n=3. *p<0.05. Growth kinetics through xCELLigence RTCA (real-time cell analysis). (C) Caski and (D) SiHa PLGA-ORM inhibited growth of Caski and SiHa cells in real time. Cells were exposed to ORM and PLGA-ORM treatments at 20 µM concentration and then measured for real-time growth kinetics. Mitochondrial membrane potential. (E) Caski and (F) SiHa cell lines were treated with 25 µM ORM and PLGA-ORM for 24 hrs and measured for mitochondrial membrane potential by TMRE stain using flow cytometer. Results were normalized to the vehicle controls (ETOH and PLGA) and free ORM. Error bars show SEM, n=3. *p<0.05.
Abbreviation: ORM, ormeloxifene.
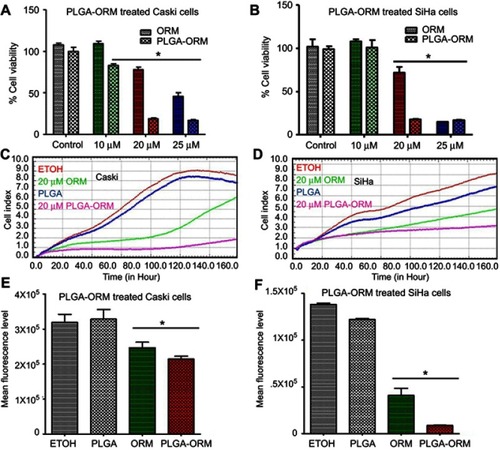
Figure 7 PLGA-ORM decreased colony forming ability of cells. Qualitative images for decreased clonogenic potential. (A) Caski and (C) SiHa cell lines were treated with ORM and PLGA-ORM (2.5, 5 and 10 µM) for 14 days. Images were taken using a UPV 810 imaging system. Graph representation of decreased clonogenic potential. (B) Caski and (D) SiHa results were normalized to the vehicle controls (ETOH and PLGA) and free ORM. Error bars show SEM, n=3. *p<0.05.
Abbreviation: ORM, ormeloxifene.
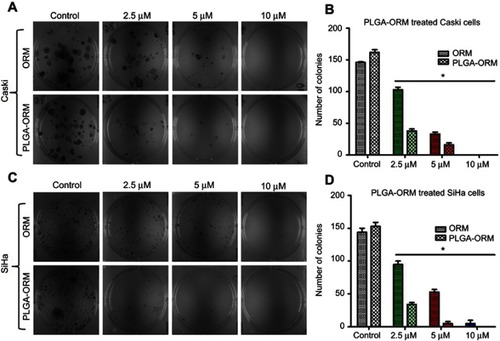
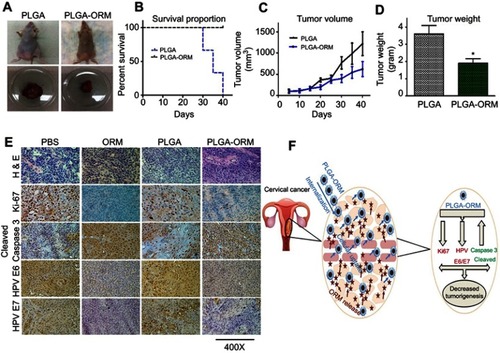
Figure 8 PLGA-ORM inhibited tumor growth of cervical cancer in orthotopic mice model. (A) Images represent mice from different treatment groups and their dissected tumors. (B) Percent survival curve for PLGA-ORM and PLGA blank treated mice. PLGA-ORM (black line) showed 100% survival in contrast to the PLGA control group. (C) Average tumor volume of PLGA-ORM and PLGA blank treated mice. PLGA-ORM markedly reduced the tumor volume over that of PLGA blank control. (D) Weight measurement for the dissected tumors. PLGA-ORM significantly reduced the tumor weight. Error bars show SEM, n=6, *p<0.05, and results were compared with vehicle control PLGA. (E) Immunohistochemical analysis. Images show modulated expression of different proteins involved in cervical cancer carcinogenesis. Images were taken at 400×. (F) A schematic diagram describing decreased cervical cancer tumorigenesis after PLGA-ORM treatment.
Abbreviation: ORM, ormeloxifene.