Figures & data
Table 1 Physicochemical properties of AgNPs by TEM and DLS
Figure 1 The morphology images and size distributions by TEM for 5 nm (A), 20 nm (B), 50 nm (C), and 100 nm (D) AgNPs.
Abbreviations: AgNPs, silver nanoparticles; TEM, transmission electron microscopy.
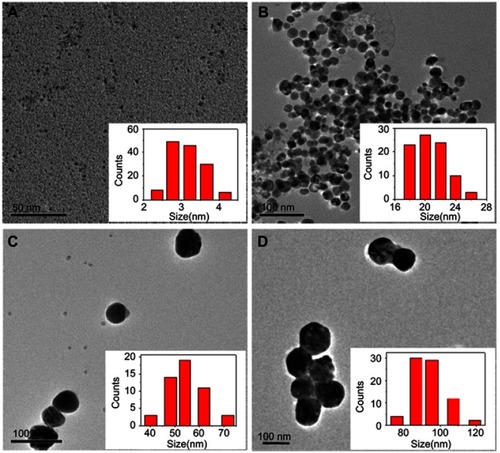
Figure 2 Uptake efficiency of AgNPs in B16 cells. After the incubation of 12 hours or 24 hours, AgNPs-treated cells were collected for ICP-MS analysis to determine the intracellular content of Ag. The uptake efficiency was calculated by the intracellular content divided by total Ag input (Mean±SD, n=6 for each group).
Abbreviations: AgNPs, silver nanoparticles; Ag, silver; ICP-MS, inductively coupled plasma mass spectrometry.
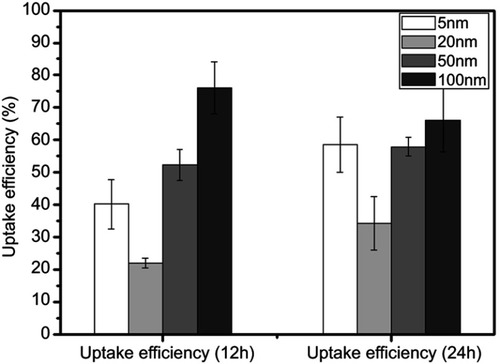
Figure S3 The recovery percentage of Ag by ICP-MS. Standard silver nitrate solutions containing 0.001–100 µg Ag were digested with microwave before ICP-MS measurement. The limit of detection of Ag was 0.003 µg by this method (n=3 for each group, black dashed line: 100% yield, red dashed line: 100±25%).
Abbreviations: Ag, silver; ICP-MS, inductively coupled plasma mass spectrometry.
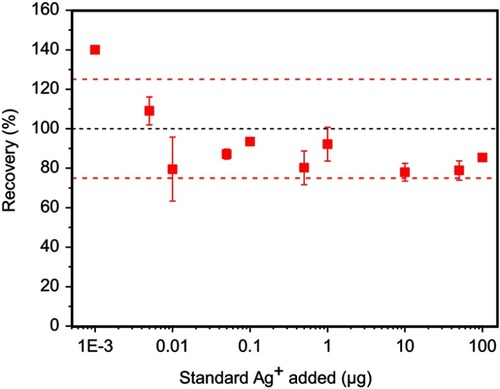
Figure 3 Interaction of AgNPs with plasma membrane after 0.5 hours exposure by TEM analysis. (A–D) The representative TEM images of 5 nm, 20 nm, 50 nm, and 100 nm AgNPs. Black arrows, vesicle-like structures outside the cell membrane.
Abbreviations: AgNPs, silver nanoparticles; TEM, transmission electron microscopy.
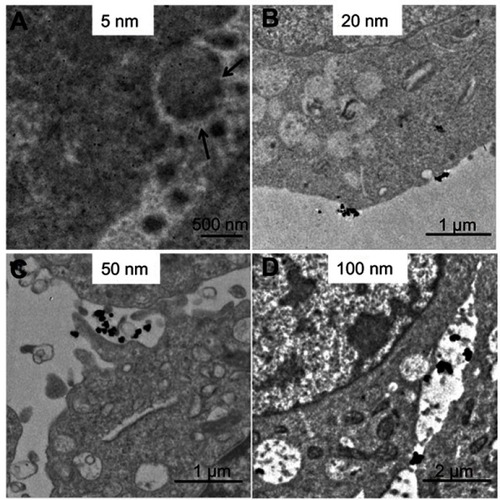
Figure 4 The cellular distribution of AgNPs after 0.5 hours (A) and 2 hours (B) exposure in B16 cells. From left to right, the four panels display the representative TEM images of 5 nm, 20 nm, 50 nm, and 100 nm AgNPs, respectively.
Abbreviations: AgNPs, silver nanoparticles; TEM, transmission electron microscopy; N, nucleus; C, cytoplasm.
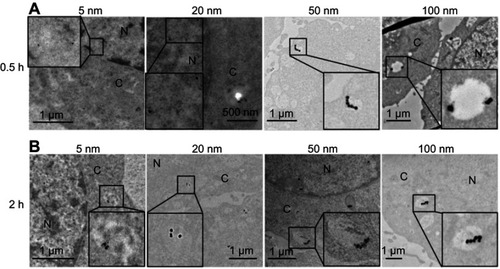
Figure 5 AgNPs uptake by B16 cells after 12 hours incubation. (A, B, E, F) The representative TEM images of 5 nm, 20 nm, 50 nm, and 100 nm AgNPs. (C, D) The amplified images of A and B, respectively.
Abbreviations: AgNPs, silver nanoparticles; TEM, transmission electron microscopy; N, nucleus; C, cytoplasm.
Figure 6 The relative uptake rate of different-sized AgNPs after inhibitor treatments in B16 cells. Cells were separately pretreated with Mβ-CD, CPZ, and EIPA before the addition of AgNPs (Mean±SD, n=4. *P<0.05, **P<0.01, significantly different from the control group). (A-D) The representative result for 5 nm, 20 nm, 50 nm , 100 nm AgNPs, respectively.
Abbreviations: AgNPs, silver nanoparticles; Mβ-CD, methyl-β-cyclodextrin; CPZ, chlorpromazine hydrochloride, EIPA, 5-(N-ethyl-N-isopropyl) amiloride.
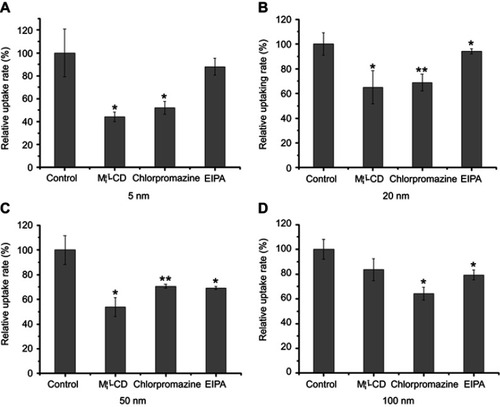
Figure S1 UV analysis of AgNPs at the concentration of 10 µg/mL.
Abbreviation: AgNPs, silver nanoparticles.
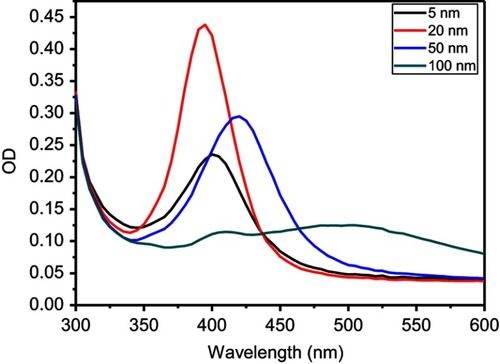
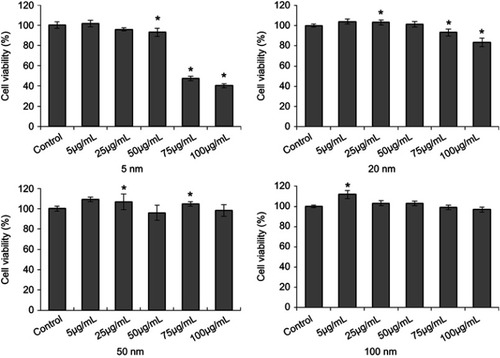
Figure S2 Cell viability of B16 cells with AgNPs treatment. After 24 hours incubation, cells were harvested and detatched by a MTS assay kit. This assay were performed three times, and representative results areshown here (Mean value±SD, n=4 for each group; *P<0.05, significantly different from the control.
Abbreviation: AgNPs, silver nanoparticles.