Figures & data
Table 1 Composition of the prepared transfersomes in molar ratio
Table 2 Composition of the prepared gel formulations with different chemical enhancers and respective concentrations used (% weight)
Table 3 Characteristic parameters of the loaded transferosomal vesicles
Figure 1 Transmission electron micrographs of the prepared transfersomes F4 when stained with uranyl acetate (10%) with scale 250 nm.
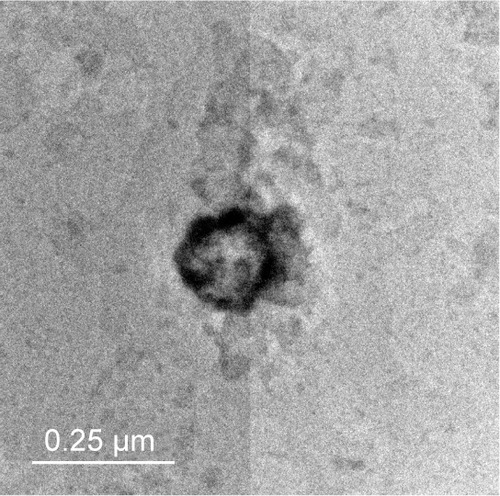
Figure 2 Release profiles of all the prepared transfersomes (each value was an average of three measurements ± SD).
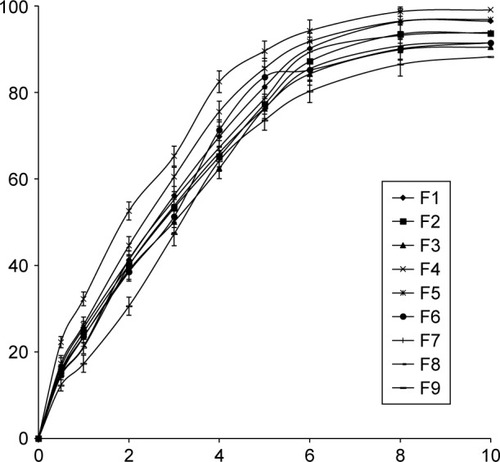
Figure 3 Rheogram representing the flow characteristics of transferosomal, free, and plain gel (dyne/cm2).
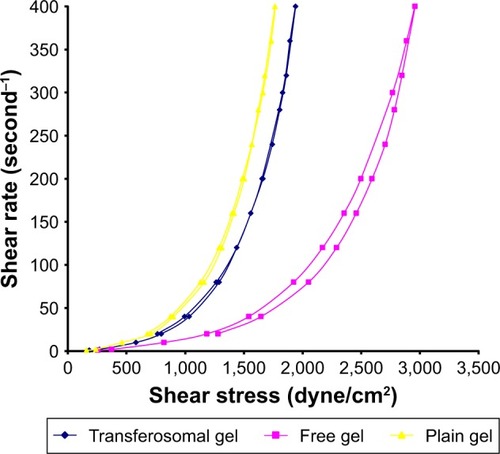
Table 4 The entrapment efficiency measurements (%) of the prepared transferosomal vesicles during storage at 4°C, 25°C, and 37°C over a period of 3 months
Table 5 The mean particle size measurements (nm) of the prepared transferosomal vesicles during storage at 4°C, 25°C, and 37°C over a period of 3 months
Table 6 The percent drug content (%) of the prepared gels during storage at 4°C, 25°C, and 37°C±2°C/75%±5% RH over a period of 3 months
Table 7 Comparative in vitro skin permeation and retention of lidocaine from various formulations
Table 8 Comparative maximum possible effect (%MPE; at 60 and 90 minutes) and AUC of various lidocaine-containing formulations
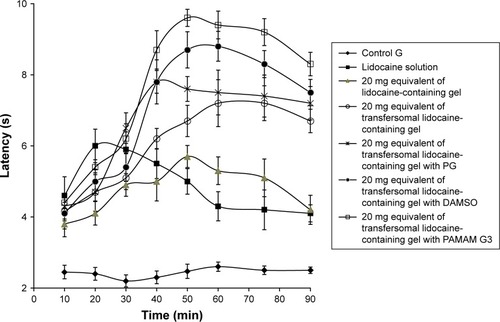
Figure 4 Effect of different permeation enhancers on the latency of tail flick after application 20 mg lidocaine equivalent in the tail flick test.
Abbreviations: PAMAM G3, polyamido amine dendrimer third generation; PG, propylene glycol.