Figures & data
Figure 1 Schematic illustration of in vivo-induced MR imaging of a tumor employing SHP2-targeted nanoparticles.
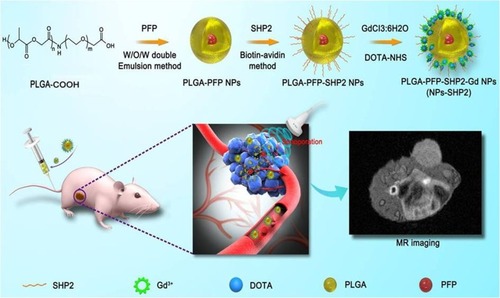
Figure 2 Characterization of the SHP2-targeted nanoparticles. (A) Brightfield optical microscopy image, (B) size distribution and (C) zeta potential.
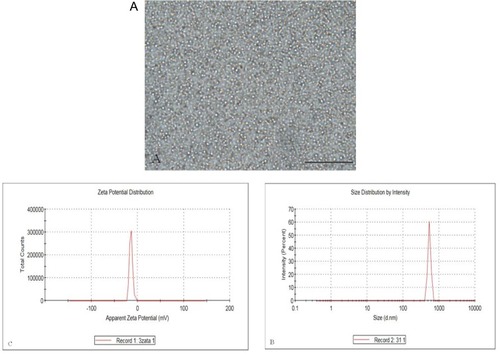
Figure 3 In vitro cytotoxicity experiments. (A) The proliferative effects of SHP2-targeted nanoparticles on Nthori3-1 cells. (B and C) After treatment with NPs in SW579 cells, SHP2-NPs and DOX, BAX and caspase-3 expression were significantly increased, while bcl-2 expression was decreased compared with any other group (**P<0.01, *P<0.05).
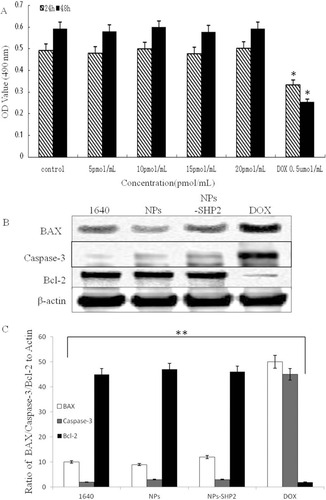
Figure 4 (A) T1-weighted images of nanoparticles with different Gd3+ concentrations and (B) the corresponding SNR (the Gd3+ concentration of nanoparticles was 1: 3.000, 2: 2.000, 3: 1.000, 4: 0.5000 and 5: 0.2500 mmol /L; and 6: 1% agarose gel solution (*P<0.05).
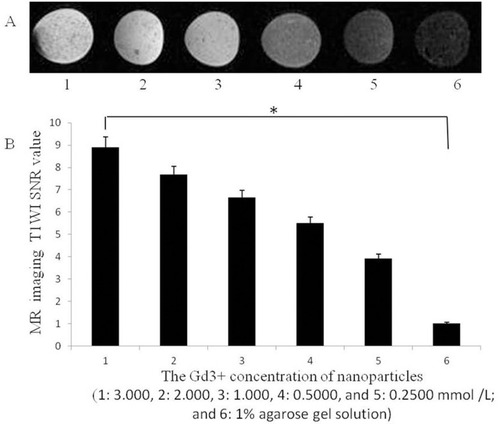
Figure 5 In vitro targeting ability experiments. (A) Fluorescence images showing the results of binding with SW579 cells for SHP2-targeted and nontargeted nanoparticles. (B) After SHP2-targeted nanoparticle treatment, the red fluorescence signal around the cells increased significantly compared with that obtained after treatment the nontargeted nanoparticles (control) (**P<0.01).
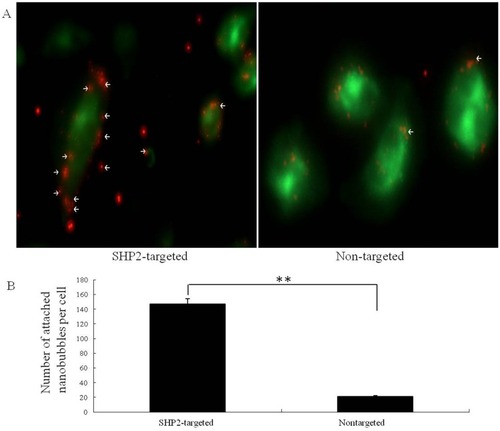
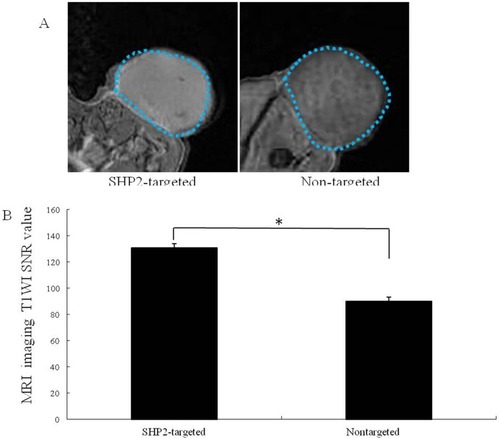
Figure 6 (A) Subcutaneous human thyroid carcinoma xenograft tumor (blue dashed line) imaged with contrast-enhanced MR after the injection of SHP2-targeted and nontargeted nanoparticles and LIFU irradiation for 5 mins. (B) The imaging signal obtained after SHP2-targeted nanoparticle injection was substantially higher than that obtained after nontargeted nanoparticle (control) injection (*P<0.05).