
Figures & data
Table 1 Solubility of celecoxib in various oils and cosurfactants
Table 2 Formulations, component ratios, celecoxib solubilities and concentrations of celecoxib loaded in microemulsions
Table 3 Particle size, zeta potential, polydispersity index (PDI) and electrical conductivity of microemulsions (MEs) without celecoxib (blank MEs) and celecoxib-loaded microemulsions (celecoxib-loaded MEs)
Figure 2 The rheological properties of celecoxib-loaded ME-1(![]()
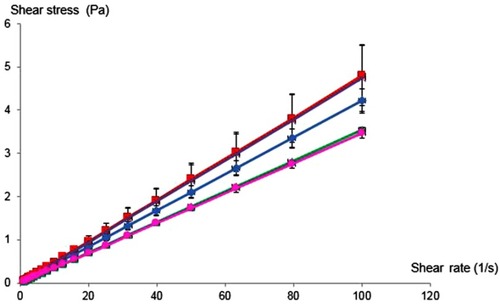
Table 4 In vitro release kinetics of celecoxib in PEG 400 and celecoxib-loaded microemulsions (ME)
Figure 3 In vitro cumulative release profiles (%) of celecoxib from PEG 400 (![]()
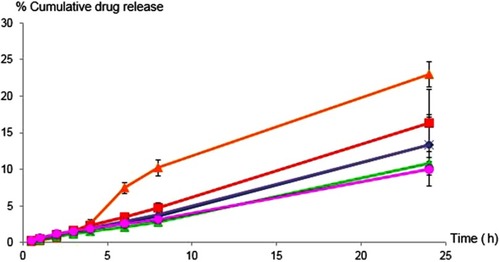
Table 5 The apparent permeability (Papp) of celecoxib from the control (PEG 400) and microemulsions (ME)
Figure 4 In vitro cumulative intestinal absorption profiles of celecoxib from PEG 400 (![]()
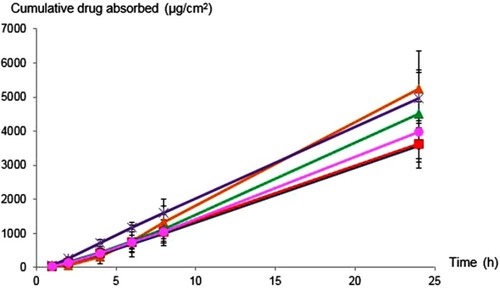
Table 6 The percent cytotoxicity of blank ME-4, celecoxib-loaded ME-4, blank PEG 400 and celecoxib in PEG 400
Figure 5 CLSM images show x-z plane sequential penetration of a porcine intestine treated with (A) Nile red in PEG 400 and (B) Nile red-loaded ME-4 after 3 h. Scale bar represents 50 µm. (C) Comparison of the fluorescence intensity profiles of Nile red at various depths in the intestine shown in Figure 5a (![]()
Abbreviation: A.U., arbitrary units.
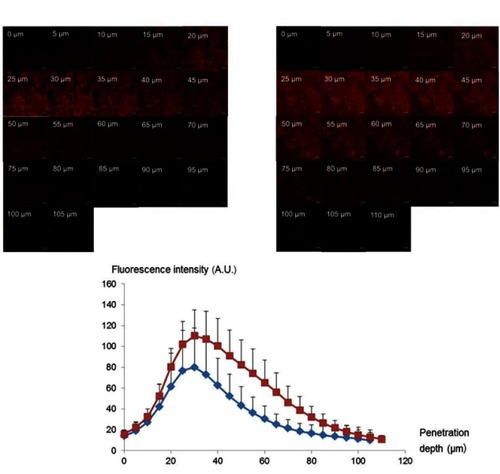
Figure 6 (A) Schematic representation of Nile red-loaded NBD-PE-labeled microemulsion particles and (B) CLSM image of an intact porcine intestine cross section stained with DAPI. MCT oil = medium-chain triglycerides oil. The scale bar represents 50 µm.
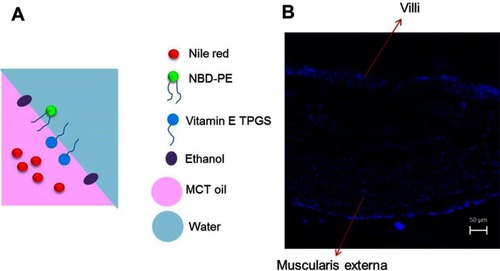
Figure 7 CLSM (x–y plane) images show a porcine intestine treated with Nile red-loaded NBD-PE-labeled microemulsion after (A) 2 h and (B) 4 h. Each image is divided into three frames as follows: (1) red fluorescence of Nile red, (2) green fluorescence of NBD-PE-labeled microemulsion particles and (3) overlay of 1 and 2. The scale bar represents 50 µm. The dash circles indicate a group of microemulsion particles from which the entrapped drugs were released into the tissues.
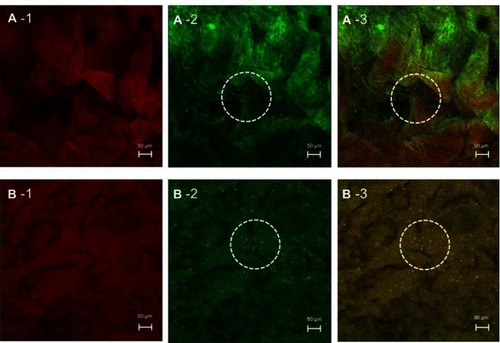
Figure 8 CLSM images show a cross-section image of a porcine intestine stained with DAPI and treated with Nile red-loaded NBD-PE-labeled microemulsion particles after 4 h from different areas (A) and (B). Each image is divided into four frames as follows: (1) red fluorescence of Nile red, (2) green fluorescence of NBD-PE, (3) blue fluorescence of DAPI and (4) overlay of 1, 2 and 3. The scale bar represents 50 µm and 100 µm for A and B, respectively.
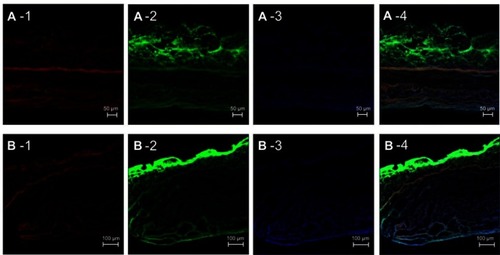
Table 7 Transepithelial electrical resistance (TEER) of porcine intestines before and after treatment with PBS, celecoxib in PEG 400 and celecoxib-loaded ME-4