Figures & data
Table 1 The formulation and the codes of all samples in 100 mL deionized water
Figure 1 XRD patterns (A) of TiO2 nanoparticles in Rutile phase, CMC film (C1), CMC/TiO2-2% (C2) nanocomposite and activated nanocomposites with 150 (SPE150), 300 (SPE300) and 450 mg/mL (SPE450) Miswak extract and FTIR analysis (B) of pure SPE-powder and all mentioned samples.
Abbreviations: C1, CMC film; C2, CMC/TONP-2% nanocomposite; CMC, carboxymethyl cellulose; FTIR, Fourier transform infrared spectroscopy; SPE, Salvadora persica L. root extract; SPE150, SPE300, and SPE450: CMC/TONP-2% containing 150, 300, and 450 mg/ml of SPE, respectively; TONP, TiO2 nanoparticles; XRD, X-ray diffraction analysis.
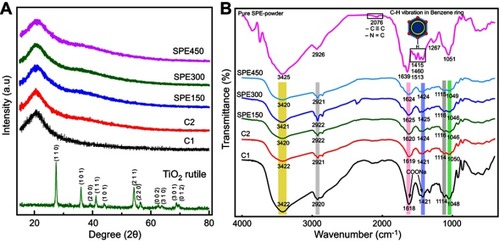
Figure 2 The SEM micrographs of surface (column 1) and cross-section (column 2); and EDX (column 3) for CMC film (A), CMC/TiO2-2% nanocomposite (B) and active nanocomposites with lower (C) and highest (D) amounts of Miswak extract, ie 150 (SPE150) and 450 mg/mL (SPE450), respectively.
Abbreviations: C1, CMC film; C2, CMC/TONP-2% nanocomposite; CMC, carboxymethyl cellulose; EDX, energy-dispersive X-ray spectroscopy; SEM, scanning electron microscopy; SPE, Salvadora persica L. root extract; SPE150, SPE300, and SPE450, CMC/TONP-2% containing 150, 300, and 450 mg/ml of SPE, respectively; TONP, TiO2 nanoparticles.
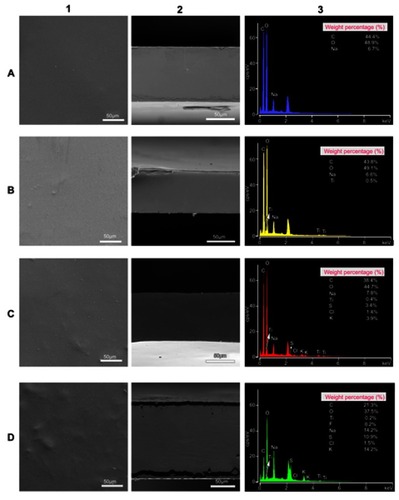
Figure 3 The elemental mapping analysis (MAP) for CMC film (A), CMC/TiO2-2% (B) nanocomposite and active nanocomposites with 150 (SPE150) (C) and 450 mg/mL (SPE450) (D) Miswak extract. The distribution of any element is separately presented by a single photo.
Abbreviations: C1, CMC film; C2, CMC/TONP-2% nanocomposite; CMC, carboxymethyl cellulose; MAP, elemental mapping analysis; SPE, Salvadora persica L. root extract; SPE150, SPE300, and SPE450, CMC/TONP-2% containing 150, 300, and 450 mg/ml of SPE, respectively; TONP, TiO2 nanoparticles.
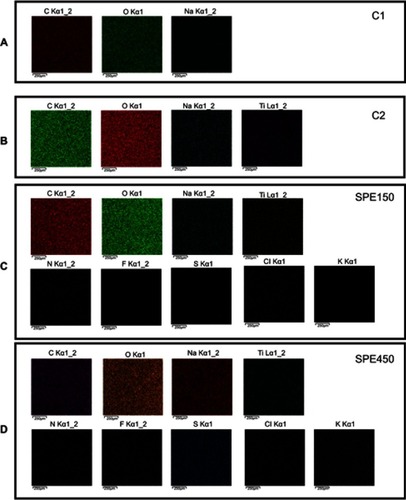
Figure 4 The moisture content (MC) (A) and water vapor permeability (WVP) (B) for CMC (C1) and CMC-TiO2 −2% (C2) control groups and all activated nanocomposites by 150 (SPE150), 300 (SPE300) and 450 mg/mL (SPE450) of Miswak extract. Various small letters present significant difference between mean values (P<0.05).
Abbreviations: C1, CMC film; C2, CMC/TONP-2% nanocomposite; CMC, carboxymethyl cellulose; MC, moisture content;SPE, Salvadora persica L. root extract; SPE150, SPE300, and SPE450, CMC/TONP-2% containing 150, 300, and 450 mg/ml of SPE, respectively; TONP, TiO2 nanoparticles; WVP, water vapor permeability.
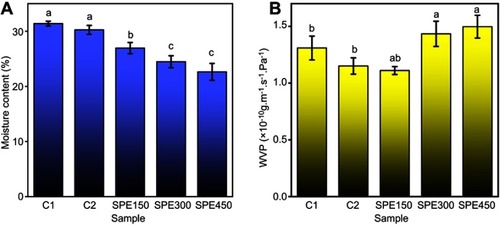
Figure 5 The mechanical behavior patterns (A), modulus (B), stress at break (C) and elongation to break (D) of CMC film (C1), CMC/TiO2-2% (C2) nanocomposite and all active nanocomposites with 150 (SPE150), 300 (SPE300) and 450 mg/mL (SPE450) Miswak extract. Various small letters present significant difference between mean values (P<0.05).
Abbreviations: C1, CMC film; C2, CMC/TONP-2% nanocomposite; CMC, carboxymethyl cellulose; SPE, Salvadora persica L. root extract; SPE150, SPE300, and SPE450, CMC/TONP-2% containing 150, 300, and 450 mg/ml of SPE, respectively; TONP, TiO2 nanoparticles.
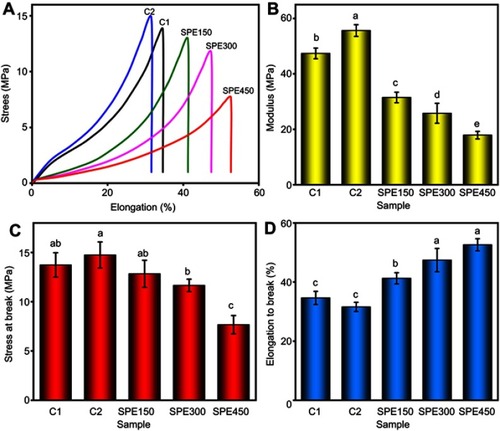
Figure 6 The TGA (A) DTG (B) curves of CMC film (C1), CMC/TiO2-2% (C2) nanocomposite and active nanocomposites with 150 (SPE150), 300 (SPE300) and 450 mg/mL (SPE450) of Miswak extract.
Abbreviations: C1, CMC film; C2, CMC/TONP-2% nanocomposite; CMC, carboxymethyl cellulose; DTG, TGA-derivative or the derivative of TGA; SPE, Salvadora persica L. root extract; SPE150, SPE300, and SPE450, CMC/TONP-2% containing 150, 300, and 450 mg/ml of SPE, respectively; TGA, thermal gravimetric analysis; TONP, TiO2 nanoparticles.
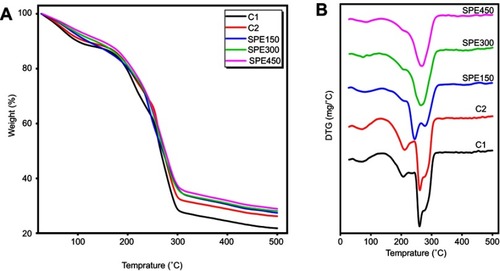
Table 2 The UV-vis transmittance and opacity of CMC (C1), CMC/TiO2-2% (C2) and activated nanocomposites by 150, 300 and 450 mg/mL S. persica extract
Figure 7 The UV-vis wavelengths transmission curves through the CMC film (C1), CMC/TiO2-2% (C2) nanocomposite and all active nanocomposites with 150 (SPE150), 300 (SPE300) and 450 mg/mL (SPE450) of Miswak extract.
Abbreviations: C1, CMC film; C2, CMC/TONP-2% nanocomposite; CMC, carboxymethyl cellulose; SPE, Salvadora persica L. root extract; SPE150, SPE300, and SPE450, CMC/TONP-2% containing 150, 300, and 450 mg/ml of SPE, respectively; TONP, TiO2 nanoparticles;UV-vis: ultraviolet-visible light.
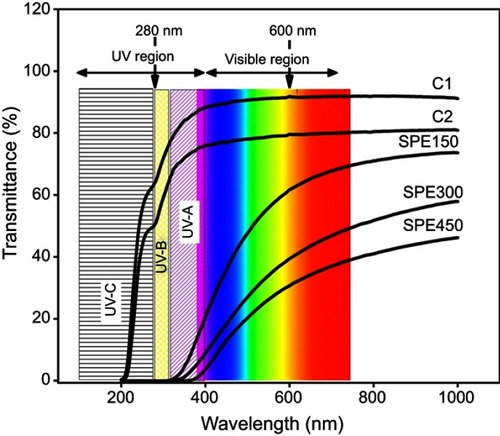
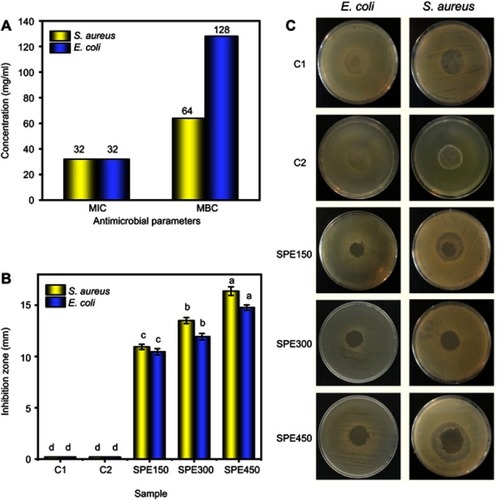
Figure 8 The MIC and MBC test for pure-SPE (A); recorded inhibition zone from disk diffusion test (B); and digital photos of disk diffusion test (C) for all samples.
Abbreviations: C1, CMC film; C2, CMC/TONP-2% nanocomposite; CMC, carboxymethyl cellulose; E. coli, Escherichia coli bacterium; MBC, minimum bactericidal concentration; MIC, minimum inhibitory concentration; S. aureus, Staphylococcus aureus bacterium; SPE, Salvadora persica L. root extract; SPE150, SPE300, and SPE450: CMC/TONP-2% containing 150, 300, and 450 mg/ml of SPE, respectively; TONP, TiO2 nanoparticles.