
Figures & data
Scheme 1 Schematic representation of the structure of MSN-BM/CD-HApt@DOX (A) and the mechanism of HER2-mediated targeted combined therapy (B).
Abbreviations: MSN, mesoporous silica nanoparticles; BM, benzimidazole; CD, β-cyclodextrin; HER2, human epidermal growth factor receptor-2; HApt, HER2 aptamer; DOX, doxorubicin.
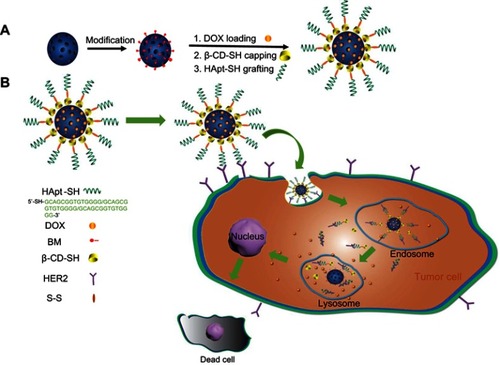
Figure S1 DOX standard curve. A fluorescence spectrophotometer (F-4500; Hitachi, Tokyo, Japan) was used to determine the fluorescence intensity of different concentrations of DOX solution (0.3-5 μg/mL) at an excitation wavelength of 480 nm, emission wavelength of 550 nm.
Abbreviation: DOX, doxorubicin.
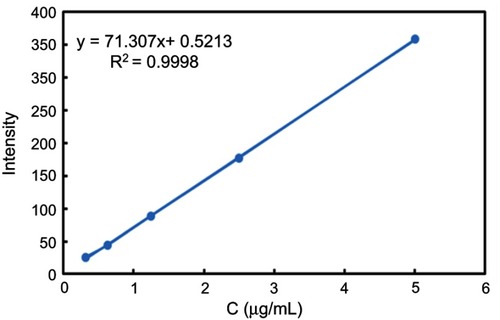
Figure 1 TEM images (A), size distribution (B) and ζ-potential values (C) of MSN, MSN-BM, MSN-BM/CD and MSN-BM/CD-HApt@DOX. Samples were dissolved in PBS (pH 7.4, 1 mM) for size and ζ-potential measurements. Data are mean ± SD (n=5).
Abbreviations: MSN, mesoporous silica nanoparticles; BM, benzimidazole; CD, β-cyclodextrin; HApt, aptamer; DOX, doxorubicin; PBS, phosphate buffered saline.
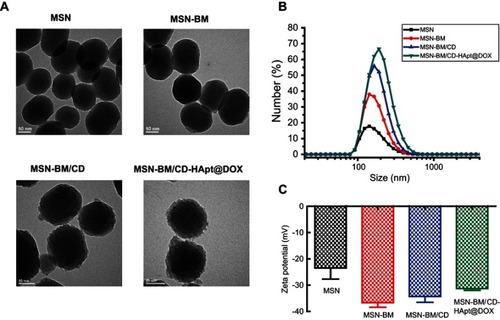
Figure 2 XRD analysis (A), FTIR spectra (B) and TGA curves (C) for MSN, MSN-BM, MSN-BM/CD and MSN-BM/CD-HApt.
Abbreviations: MSN, mesoporous silica nanoparticles; BM, benzimidazole; CD, β-cyclodextrin; HApt, aptamer; DOX, doxorubicin.
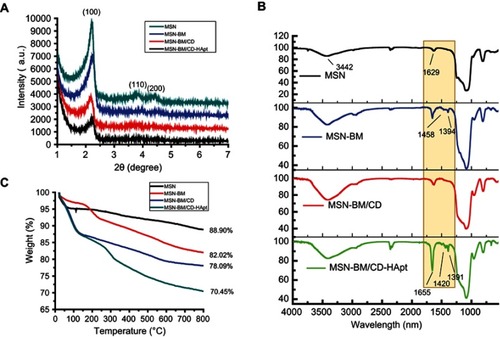
Figure 3 Brunauer–Emmett–Teller nitrogen adsorption/desorption isotherms (A) and Barrett–Joyner–Halenda pore size distributions (B) for MSN, MSN-BM and MSN-BM/CD-HApt@DOX.
Abbreviations: MSN, mesoporous silica nanoparticles; BM, benzimidazole; CD, β-cyclodextrin; HApt, aptamer; DOX, doxorubicin.
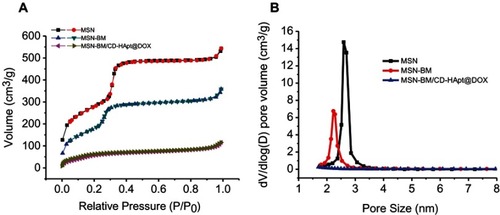
Figure 4 In vitro drug release behavior of MSN-BM/CD-HApt@DOX created via two MSN-BM synthetic pathways at neutral (PBS, pH 7.4) and acidic (PBS, pH 6.4 and 4.5) conditions at 37 °C. In Path I (A), the template was removed and then benzimidazole was modified. The BM existed both in porous channels and on the surface of MSN; in path II (B), benzimidazole was modified, then the template was removed. The BM only existed on the surface of MSN. The pH-dependent release rates of DOX from MSN-BM/CD-HApt@DOX produced by both pathways were quantified via fluorescence spectrophotometry. The nanoparticle concentration was 100 μg/mL, equivalent to 3.6 μg/mL DOX for Path I and 2.6 μg/mL DOX for Path II. Data are mean ± SD (n= 3).
Abbreviations: MSN, mesoporous silica nanoparticles; BM, benzimidazole; CD, β-cyclodextrin; HApt, aptamer; DOX, doxorubicin.
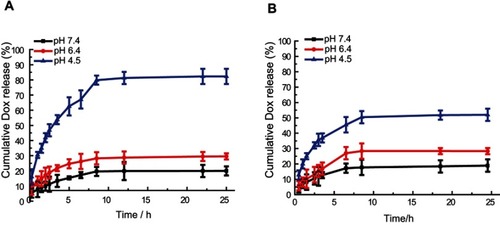
Figure 5 CLSM images of MCF7 (A) and SKBR3 (B) cells incubated with MSN-BM/CD-HApt@DOX (relative DOX concentration, 3.6 μg/mL) for 4 h. (C) CLSM images of SKBR3 cells pretreated with free HApt (1 μM) for 30 min and then co-incubated with MSN-BM/CD-HApt@ DOX (relative DOX concentration, 3.6 μg/mL) for 4 h. Flow cytometric analysis (D) and mean fluorescence intensity (MFI, E) of MCF7 cells (I and II, orange) incubated with MSN-BM/CD-HApt@DOX (relative DOX concentration, 3.6 μg/mL) for 4 h (II). SKBR3 cells (III, IV and V, purple) incubated with MSN-BM/CD-HApt@DOX (relative DOX concentration, 3.6 μg/mL) in the absence (IV) or presence (V) of free HApt (1 μM) for 4 h. I and III are the corresponding untreated MCF7 and SKBR3 cells. DOX is shown in red; nuclei are stained with Hochest 33,342 (blue). All scale bars are 50 μm. MFI was measured from three independent experiments (n=3). Data are mean ± SD (n =3), **P<0.01 is considered statistically significant.
Abbreviations: MSN, mesoporous silica nanoparticles; BM, benzimidazole; CD, β-cyclodextrin; HApt, aptamer; DOX, doxorubicin.
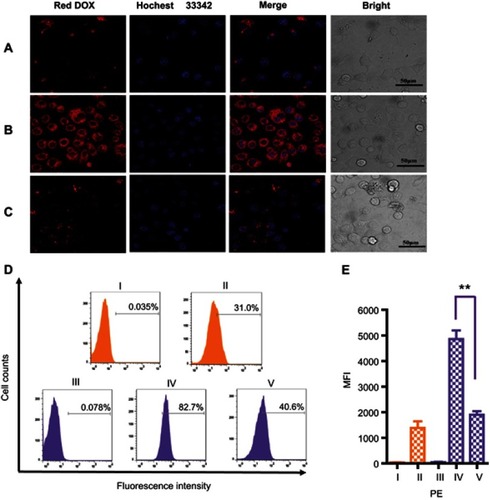
Figure 6 CLSM images of MCF7 (A) and SKBR3 (B) cells incubated with MSN-BM/CD-NCApt@DOX (relative DOX concentration, 3.6 μg/mL) for 4 h. (C) CLSM images of SKBR3 cells pretreated with free HApt (1 μM) for 30 min and then co-incubated with MSN-BM/CD-NCApt@DOX (relative DOX concentration, 3.6 μg/mL) for 4 h. Flow cytometry analysis (D) and mean fluorescence intensity (MFI, E) of MCF7 cells (I and II, orange) incubated with MSN-BM/CD-NCApt@DOX (relative DOX concentration, 3.6 μg/mL) for 4 h (II). SKBR3 cells (III, IV and V, purple) incubated with MSN-BM/CD-NCApt@DOX (relative DOX concentration, 3.6 μg/mL) in the absence (IV) or presence (V) of free HApt (1 μM) for 4 h. I and III are the corresponding untreated MCF7 and SKBR3 cells. DOX is shown in red; nuclei are stained with Hoechst 33342 (blue). All scale bars are 50 μm. MFI was measured from three independent experiments (n=3). Data are mean ± SD (n = 3).
Abbreviations: MSN, mesoporous silica nanoparticles; BM, benzimidazole; CD, β-cyclodextrin; HApt, aptamer; DOX, doxorubicin.
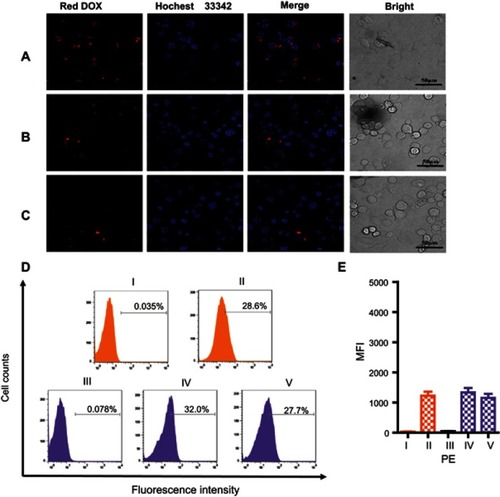
Figure 7 Cell viability of SKBR3 (A), MCF7 (B) and HEK-293T (C) cells incubated with unloaded MSN-BM/CD-HApt, MSN-BM/CD-NCApt or MSN-BM/CD. Cells were incubated with various concentrations of unloaded nanoparticles (10 to 500 μg/mL) for 4 h, then the media was replaced by fresh complete medium and incubated for another 20 h. Cell viability was measured using the Cell Counting Kit-8 (CCK-8). Data are mean ± SD (n = 5).
Abbreviations: MSN, mesoporous silica nanoparticles; BM, benzimidazole; CD, β-cyclodextrin; HApt, aptamer; DOX, doxorubicin.
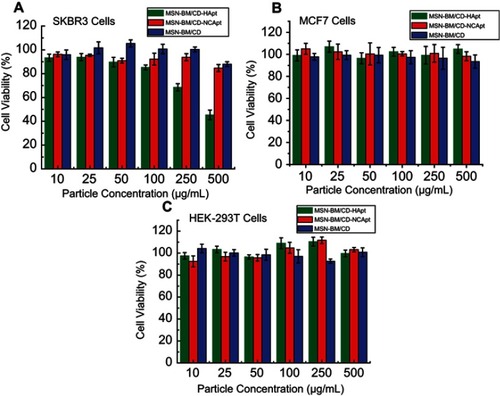
Figure 8 Cell viability of MCF7 and SKBR3 cells incubated with MSN-BM/CD-HApt@DOX (A) or MSN-BM/CD-NCApt@DOX (B) in the absence/presence of free HApt (1 μM) for 24 h. Cells were incubated with various concentrations of MSN-BM/CD-HApt@DOX or MSN-BM/CD-NCApt@DOX for 4 h, and then with fresh complete media for 20 h. To assay HER2 receptor inhibition, cells were pretreated with free HApt (1 μM) for 30 min, co-incubated with MSN-BM/CD-HApt@DOX or MSN-BM/CD-NCApt@DOX for 4 h, and then cultured in fresh complete media for 20 h. Cell viability was measured using the CCK-8 assay. Data are mean ± SD (n = 5).
Abbreviations: MSN, mesoporous silica nanoparticles; BM, benzimidazole; CD, β-cyclodextrin; HApt, aptamer; DOX, doxorubicin.
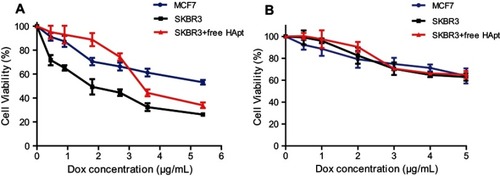
Figure 9 Combined therapeutic effect of MSN-BM/CD-HApt@DOX. SKBR3 cells were exposed to cell culture media (Mock) or cell culture media containing free DOX, MSN-BM/CD@DOX, MSN-BM/CD-HApt, MSN-BM/CD-HApt@DOX or MSN-BM/CD-NCApt@DOX (nanoparticle concentration, 100 μg/mL; DOX concentration, 3.6 μg/mL) for 4 h, and then cultured in fresh complete media for 20 h. Cell viability was measured using the CCK-8 assay. Data are mean ± SD (n = 3).
Abbreviations: MSN, mesoporous silica nanoparticles; BM, benzimidazole; CD, β-cyclodextrin; HApt, aptamer; DOX, doxorubicin.
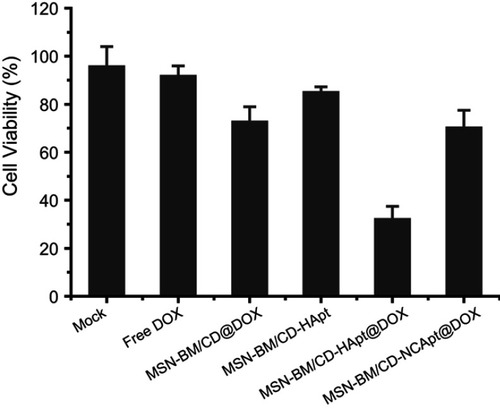
Table S1 Properties and parameters of MSN, MSN-BM, MSN-BM/CD and MSN-BM/CD-HApt@DOX
Table S2 Brunauer–Emmett–Teller and Barrett–Joyner–Halenda measurements for MSN before and after grafting with functional groups
Table S3 Brunauer–Emmett–Teller, Barrett–Joyner–Halenda measurements and drug-loading content (DLC) of two MSN-BM synthetic pathways