Figures & data
Scheme 1 Schematic of the targeting and activation of JF1. (A) Activation of JF1 by cathepsin B. (B) In vivo targeting of tumor.
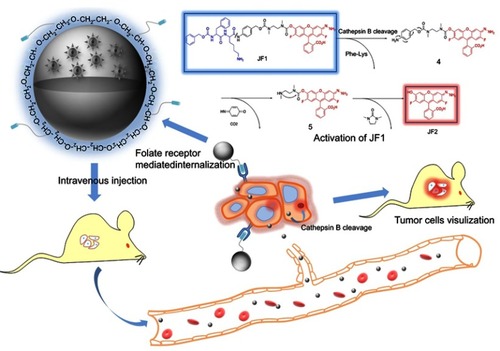
Figure 1 Optical characterization of JF1. (A). Excitation and emission spectra of JF1. (B). Emission spectra of JF1 and JF1 loaded CaCO3 nanoparticle under cathepsin (B).
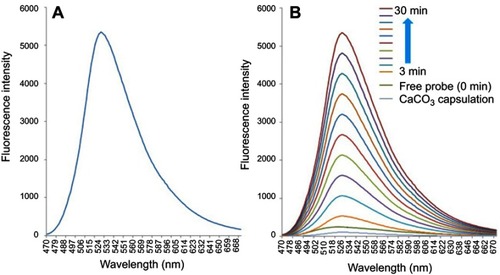
Figure 2 Characterization and release profile of CaCO3 nanoparticles. (A). Zeta potential of CaCO3 nanoparticles before and after folate-PEG modification. (B). Emission spectra of CaCO3 nanoparticles under different PH conditions. (C). SEM of CaCO3 nanoparticles. Scale bar: 200 nm.
Abbreviation: SEM, scanning electron microscope.
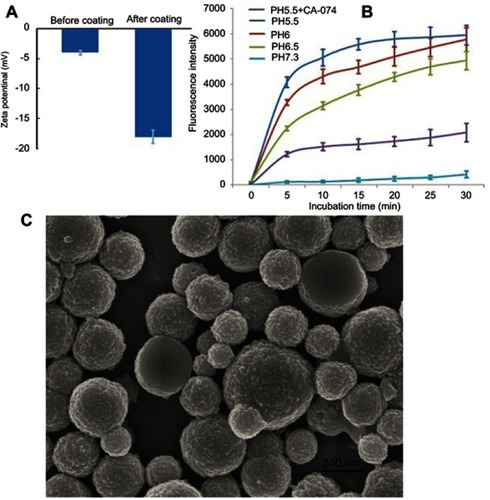
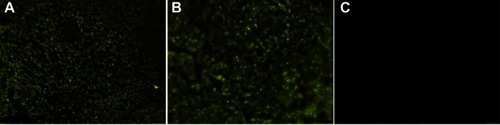
Figure 3 In vitro imaging of MCF7 cells using CaCO3 nanoprobe. The upper row shows MCF7 cells incubated with nanoprobe for 30 mins. The second row shows fibroblast cells incubated with nanoprobe for 24 hrs.
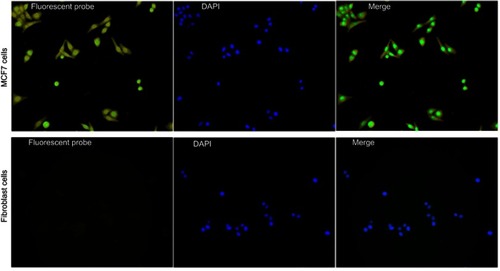
Figure 4 In vivo imaging of MCF7 baring mice using CaCO3 nanoprobe.
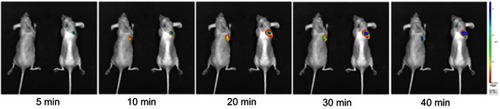
Figure 5 Histology analysis of heart, liver, spleen, lung, and kidney. No pathological change was observed in these tissues; 20 × magnification.
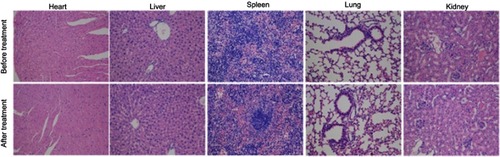
Figure S1 The fluorescence intensity of mice with different tumor loads. (A). Mouse without tumor shows no fluorescence (left) and tumor-bearing mouse has high fluorescence. (B). Fluorescence intensity is higher in larger tumor (middle) than in the smaller ones
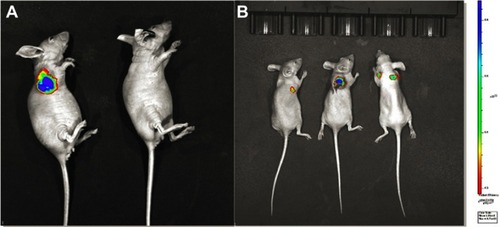
Figure S2 Frozen section of tumor tissue and adjacent normal tissue. (A). Tumor tissue with 20× magnification. (B). Tumor tissue with 40× magnification. (C). Adjacent normal tissue