Figures & data
Figure 1 Chemical structures of the arginine-containing cationic lipids. n indicates the carbon number of the alkyl chains, and x indicates the carbon number of the spacers between the hydrophilic and hydrophobic parts.
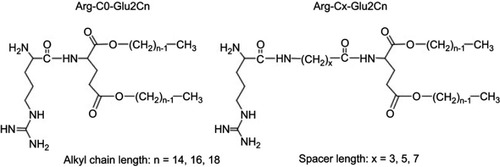
Figure 2 NLRP3 inflammasome activation of macrophages and monocytes induced by arginine-containing cationic liposomes. LPS (1 ng/mL)-primed human macrophages (A), LPS (100 ng/mL)-primed immortalized murine macrophages (B), and PMA (100 nM)-primed THP-1 cells (C) were incubated with 100 μM or 50 μM cationic liposomes for 18 hrs. The NLRP3 inflammasome activation was evaluated by the release of IL-1ß using human or murine IL-1ß ELISA kit. Data show the mean + SD of three replicates; **P<0.01. (D) NLRP3 inhibitor CP-456773 and caspase-1 (casp-1) inhibitor VX765 suppressed NLRP3 inflammasome activation induced by A3C14 and A5C14 liposomes. 5 μM NLRP3 inhibitor CP-456773 (also known as CRID3) or 25 μM casp-1 inhibitor VX765 was added to the LPS-primed human macrophages prior to the addition of 100 μM liposomes. The release of IL-1β was detected by HTRF and the inhibition rate was calculated to indicate the suppression level of IL-1β by each inhibitor. Data show the mean + SE of two independent experiments (ie, macrophages were collected from two different donors and the measurements were performed at different days) with two replicates, respectively.
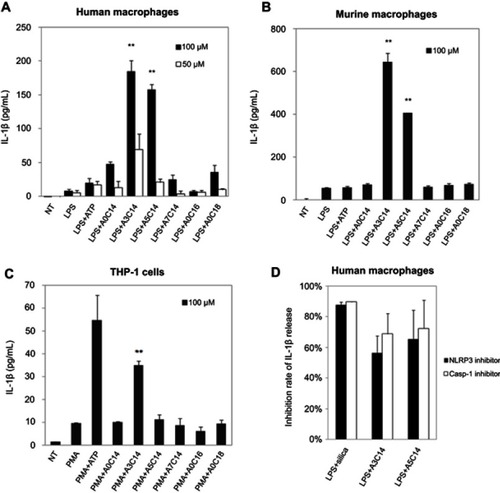
Figure 3 Arginine-containing cationic liposomes induced the lysosome rupture in PMA-primed THP-1 cells. Acridine orange (AO) was incubated with cells for 15 mins prior to overnight exposure to cationic liposomes. (A) Gating strategies of THP-1 cells using flow cytometry. Cells were first gated by forward scatter (FSC)-height (H) vs side scatter (SSC)-H, and then gated by FSC-area (A) vs FSC-H. The fluorescence intensities of AO were recorded to evaluate the percentage of the cells with significant lysosome rupture (B). Data show the mean + SD of three independent experiments; *P<0.05.
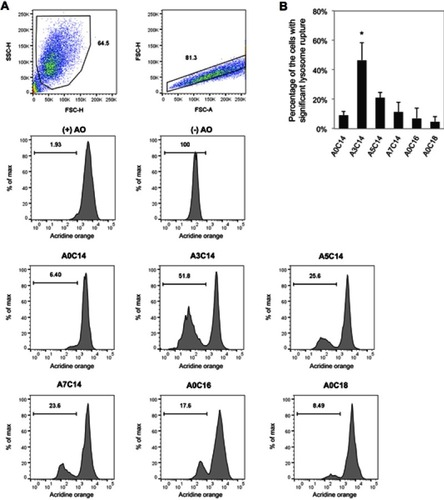
Table 1 Formulation and characterization of cationic liposomes. Data show the mean ± SD (n=3)
Figure 4 Antigen delivery efficiency of arginine-containing cationic liposomes in BMDCs. Alexa Fluor 555-conjugated OVA (fc: 2.5 μg/mL) was freely dispersed or loaded on cationic liposomes (fc: 25 μM), and incubated with BMDCs for 2 hrs. The extracellular OVA-liposomes were washed off, and the intracellular OVA was measured by flow cytometry. (A) Cells were first gated by FSC-A vs SSC-A, and then gated by SSC-A vs SSC-H. (B) Representative histograms and (C) mean fluorescent intensities of intracellular OVA. Data show the mean + SD of two independent experiments with two replicates, respectively.
Abbreviations: BMDCs, bone marrow-derived dendritic cells; OVA, ovalbumin; FSC, forward scatter; SSC, side scatter; A, area; H, height.
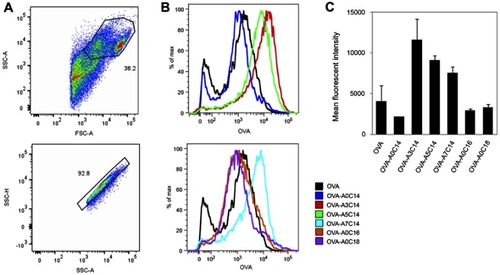
Figure 5 Activation of OT-I and OT-II cells through MHC-I and MHC-II mediated antigen presentation pathways, respectively. BMDCs were incubated with OVA (fc: 25 μg/mL)-loaded cationic liposomes (fc: 25 μM) or the same concentration of soluble OVA, or the same concentration of liposomes for 2 hrs, and then extracellular OVA or liposomes were washed off with DPBS. CFSE was used to label splenocytes from OT-I mice (A, C, E) or OT-II mice (B, D, F) and then labeled cells were added into the BMDC culture plate. The supernatant was partially collected after overnight incubation to detect the secretion of IL-2 using an ELISA kit (A, B); and the cells were collected after 48 hrs incubation to analyze the OT-I cell and OT-II cell division using flow cytometry (C, D, E, F, see gating strategies of OT-I and OT-II cells in Figure S5). (−) Lipo indicates the BMDCs without treatment [(−) OVA] or treated with soluble OVA [(+) OVA]; other experimental groups were treated with naked liposomes [(−) OVA], or OVA-loaded liposomes [(+) OVA]. Data show the mean+SD of two independent experiments with two replicates, respectively; *P<0.05, **P<0.01.
Abbreviations: BMDCs, bone marrow-derived dendritic cells; OVA, ovalbumin; CFSE, carboxyfluorescein succinimidyl ester.
![Figure 5 Activation of OT-I and OT-II cells through MHC-I and MHC-II mediated antigen presentation pathways, respectively. BMDCs were incubated with OVA (fc: 25 μg/mL)-loaded cationic liposomes (fc: 25 μM) or the same concentration of soluble OVA, or the same concentration of liposomes for 2 hrs, and then extracellular OVA or liposomes were washed off with DPBS. CFSE was used to label splenocytes from OT-I mice (A, C, E) or OT-II mice (B, D, F) and then labeled cells were added into the BMDC culture plate. The supernatant was partially collected after overnight incubation to detect the secretion of IL-2 using an ELISA kit (A, B); and the cells were collected after 48 hrs incubation to analyze the OT-I cell and OT-II cell division using flow cytometry (C, D, E, F, see gating strategies of OT-I and OT-II cells in Figure S5). (−) Lipo indicates the BMDCs without treatment [(−) OVA] or treated with soluble OVA [(+) OVA]; other experimental groups were treated with naked liposomes [(−) OVA], or OVA-loaded liposomes [(+) OVA]. Data show the mean+SD of two independent experiments with two replicates, respectively; *P<0.05, **P<0.01.Abbreviations: BMDCs, bone marrow-derived dendritic cells; OVA, ovalbumin; CFSE, carboxyfluorescein succinimidyl ester.](/cms/asset/394adf3f-db48-45a8-8d9b-f5b51c44bf59/dijn_a_12190881_f0005_b.jpg)
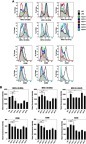
Figure 6 Flow cytometry of activation markers on BMDCs. BMDCs were incubated with each type of the liposomes (fc: 50 μM) for 2 hrs and then washed off. After further incubation overnight in the fresh culture medium, the cells were labeled with fluorescent antibodies against MHC-I (H-2Db), MHC-I (H-2Kb), MHC-II (I-A/I-E), CD80, CD86, and CD40 followed by flow cytometry (A, see gating strategies in Figure S6). (B) The mean fluorescent intensities were measured and data show the mean + SD of two independent experiments with two replicates, respectively. *P<0.05, **P<0.01. Note that the liposomes were not associated with OVA. LPS was used as a positive stimulus. Abbreviations: BMDCs, bone marrow-derived dendritic cells; LPS, lipopolysaccharide; OVA, ovalbumin.