
Figures & data
Table 1 Mean particle size, PDI, ZP, and EE% of GA-NLC, cRGDfK-GA-NLCand E-[c(RGDfK)2]-GA-NLC (Mean ± SD, n=3)
Figure 1 The size and morphology of the formulations: (A and B) are particle size distribution and zeta potential of GA-NLC, (C and D) are particle size distribution and zeta potential of c(RGD) peptides modified GA-NLC as determined by dynamic light scattering. E represents the TEM images of c(RGD) peptide modified GA-NLC (scale bar=200 nm).
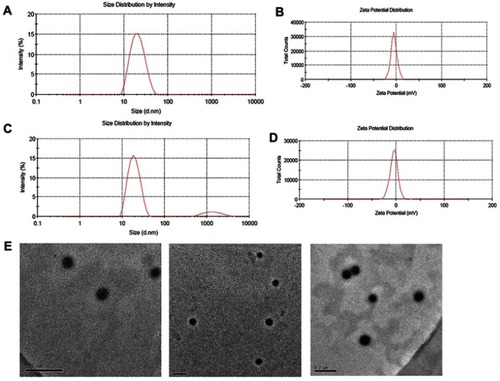
Figure 2 4T1 cell viability after 24 h incubation with free GA (solution), blank NLC, GA-NLC, c(RGDfK)-GA-NLC, and E-[c(RGDfK)2]-GA-NLC to 4T1 cells. At lower concentration of GA, c(RGD) peptides modified GA-NLC showed significantly lower cell viability (%). Free GA was able to inhibit the growth of 4T1 cell only at higher concentration (*p-value <0.05 represent vs GA-NLC).
![Figure 2 4T1 cell viability after 24 h incubation with free GA (solution), blank NLC, GA-NLC, c(RGDfK)-GA-NLC, and E-[c(RGDfK)2]-GA-NLC to 4T1 cells. At lower concentration of GA, c(RGD) peptides modified GA-NLC showed significantly lower cell viability (%). Free GA was able to inhibit the growth of 4T1 cell only at higher concentration (*p-value <0.05 represent vs GA-NLC).](/cms/asset/c0928a58-2990-4cb7-8213-c62917fcdedc/dijn_a_12190884_f0002_c.jpg)
Figure 3 Cell uptake of C-6 labeled formulations by 4T1 cells: (A) the image of cell uptake of C-6 labeled formulations by 4T1 cell after 12 h incubation. Green color belongs to C-6 and blue is DAPI. (B) the FI of C-6 labeled NLC and c(RGD)s modified C-6 labeled NLC at different incubation time interval (1 h, 4 h, and 12 h); (***p-value <0.001 indicate in comparison to C-6-NLC).
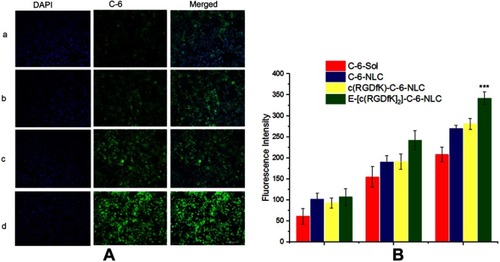
Figure 4 In-vivo antitumor effect of the formulations. (A) Changes in tumor volume after cell inoculation (day 0–20) and over the course of treatment (day 10–20). At the last day of the treatment the mice treated with [c(RGDfK)2]-GA-NLC and Cisplatin showed considerably lower tumor volume in comparison to free GA, GA-NLC and control group. (B) Weight of tumor at the end of treatment excised from mice treated with different formulations of GA. (***p-value <0.001 and *p-value <0.05 in relation to GA-NLC).
![Figure 4 In-vivo antitumor effect of the formulations. (A) Changes in tumor volume after cell inoculation (day 0–20) and over the course of treatment (day 10–20). At the last day of the treatment the mice treated with [c(RGDfK)2]-GA-NLC and Cisplatin showed considerably lower tumor volume in comparison to free GA, GA-NLC and control group. (B) Weight of tumor at the end of treatment excised from mice treated with different formulations of GA. (***p-value <0.001 and *p-value <0.05 in relation to GA-NLC).](/cms/asset/abcd4f08-06f4-4c49-98ab-42a0376fbb4e/dijn_a_12190884_f0004_c.jpg)
Figure 5 Histological examination of major organ and tumor tissue after treatment with (A) Normal Saline, (B) Cisplatin, (C) GA Sol, (D) GA-NLC, (E) c(RGDfK)-GA-NLC, (F) E-[c(RGDfK)2]-GA-NLC (Magnification 200×). No significantly serious histological change was observed in main organs, however extensively necrotic, and the necrotic cells in tumor tissues of all treatment group.
![Figure 5 Histological examination of major organ and tumor tissue after treatment with (A) Normal Saline, (B) Cisplatin, (C) GA Sol, (D) GA-NLC, (E) c(RGDfK)-GA-NLC, (F) E-[c(RGDfK)2]-GA-NLC (Magnification 200×). No significantly serious histological change was observed in main organs, however extensively necrotic, and the necrotic cells in tumor tissues of all treatment group.](/cms/asset/df33f0e0-61bf-40a3-8a77-90ac07f0347c/dijn_a_12190884_f0005_c.jpg)
Figure 6 Immunohistochemical staining results of tumor tissue after treatment with different formulations of GA. (A) Integrated optical density (IOD) of Ki67 expression. (B) Microvessel counts (MVCs) of CD31. (C) IHC staining images of both Ki67 and CD31. (*p<0.05 vs GA-NLC, **p<0.01 vs GA-NLC).
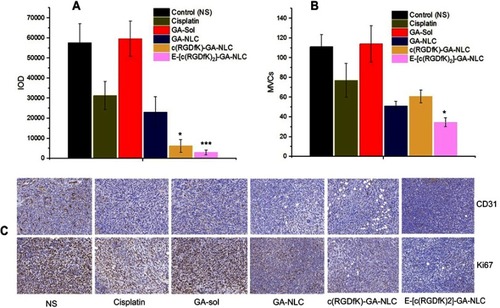
Figure 7 (A) Change in body weight of BALB/c nude during the treatment period with blank NLC and its c(RGD) peptides conjugate. (B) Organ indices calculated from the major organs removed after 24 h of the last day treatment.
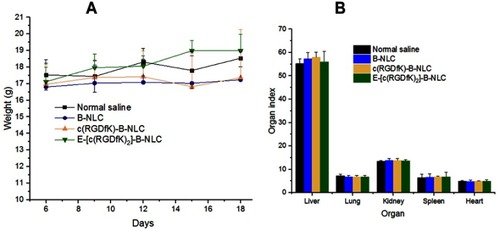
Figure 8 HE staining of major organ after treatment with (A) Normal Saline, (B) Blank-NLC (B-NLC), (C) c(RGDfK)-B-NLC, (D) E-[c(RGDfK)2]-GA-NLC (magnification 100×).
![Figure 8 HE staining of major organ after treatment with (A) Normal Saline, (B) Blank-NLC (B-NLC), (C) c(RGDfK)-B-NLC, (D) E-[c(RGDfK)2]-GA-NLC (magnification 100×).](/cms/asset/504ab04b-3b74-484e-9818-ff33145752f5/dijn_a_12190884_f0008_c.jpg)
Figure 9 Bio-distribution study of c(RGD) modified DiR-NLC in tumor bearing mice. A: Free DiR (A), DiR-NLC (B), c(RGDfK)-DiR-NLC (C), and E-[c(RGDfK)2]-DiR-NLC (D) fluorescence images of mice treated with different DiR formulations in-vivo at different time points (2, 3, 6, 18, 21, and 24 h); B: Ex-vivo fluorescence images of mice organs and tumor tissues excised from mice treated with different DiR formulations; and C: fluorescence signal of liver and tumor obtained from mice treated with different DiR formulations (*p<0.05 vs DiR-NLC).
![Figure 9 Bio-distribution study of c(RGD) modified DiR-NLC in tumor bearing mice. A: Free DiR (A), DiR-NLC (B), c(RGDfK)-DiR-NLC (C), and E-[c(RGDfK)2]-DiR-NLC (D) fluorescence images of mice treated with different DiR formulations in-vivo at different time points (2, 3, 6, 18, 21, and 24 h); B: Ex-vivo fluorescence images of mice organs and tumor tissues excised from mice treated with different DiR formulations; and C: fluorescence signal of liver and tumor obtained from mice treated with different DiR formulations (*p<0.05 vs DiR-NLC).](/cms/asset/fd264bff-fc7d-4d28-9568-1ea80c5e8975/dijn_a_12190884_f0009_c.jpg)