Figures & data
Figure 1 Schematic diagram of fabrication process of Ag-TiO2@PDA nanorods coatings.
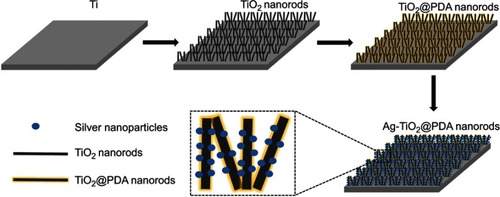
Figure 2 Sample surface characterization and Ag+ ions release. (A) FE-SEM images of various surfaces (scale bars =3 μm); (B) corresponding EDS spectrum of various samples; (C) TEM images of Ag-TiO2@PDA NRDs (scale bars =100 [left panel] and 20 [right panel] nm); (D) Ag-release profiles from Ag-TiO2 NRDs and Ag-TiO2@PDA NRDs into PBS; (E) water contact angles and photographs of water droplets on various surfaces; (F) XPS spectra of various samples; (F1) C 1s peak of Ag-TiO2 NRDs; (F2) C 1s peak of Ag-TiO2@PDA NRDs.
![Figure 2 Sample surface characterization and Ag+ ions release. (A) FE-SEM images of various surfaces (scale bars =3 μm); (B) corresponding EDS spectrum of various samples; (C) TEM images of Ag-TiO2@PDA NRDs (scale bars =100 [left panel] and 20 [right panel] nm); (D) Ag-release profiles from Ag-TiO2 NRDs and Ag-TiO2@PDA NRDs into PBS; (E) water contact angles and photographs of water droplets on various surfaces; (F) XPS spectra of various samples; (F1) C 1s peak of Ag-TiO2 NRDs; (F2) C 1s peak of Ag-TiO2@PDA NRDs.](/cms/asset/e3c30da0-fbc2-4f19-b2a4-52021431ced4/dijn_a_12190890_f0002_c.jpg)
Figure 3 Antibacterial activity in vitro. (A) FE-SEM morphology of methicillin-resistant Staphylococcus aureus (MRSA) seeded on the various surfaces (scale bars =1 μm); (B) FE-SEM morphology of Escherichia coli (E. coli) seeded on the various surfaces (scale bars =2 μm); (C) fluorescent images of stained MRSA and bacterial suspension (insert in part C) after co-cultured with various surfaces for 24 hrs (scale bars =50 μm); (D) fluorescent images of stained MRSA and bacterial suspension (insert in part D) after co-cultured with various surfaces for 48 hrs (scale bars =50 μm); (E) zone of inhibition (ZOI) test of the various coatings against MRSA; (F) ZOI test of the various coatings against E. coli.
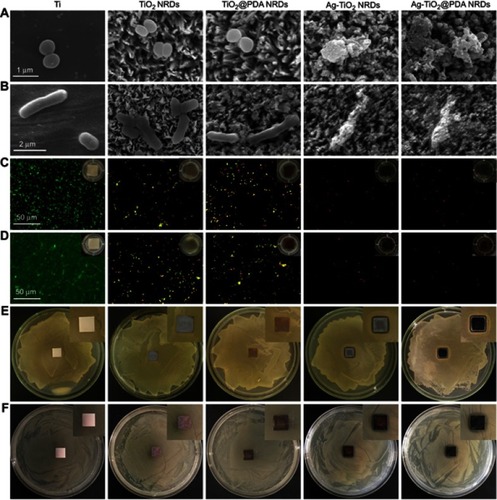
Figure 4 Anti-adherent bacterial activity in vitro. (A) Methicillin-resistant Staphylococcus aureus (MRSA) recultured on agar after dissociation from Ag-TiO2 NRDs and Ag-TiO2@PDA NRDs at day 1, day 7, and day 14; (B) Escherichia coli (E. coli) recultured on agar after dissociation from Ag-TiO2 NRDs and Ag-TiO2@PDA NRDs at day 1, day 7, and day 14; (C) MRSA and E. coli recultured on agar after dissociation from Ti, TiO2 NRDs, and TiO2@PDA NRDs at day 1. The error bars indicate means ± standard deviations: *p<0.05 and ***p<0.001.
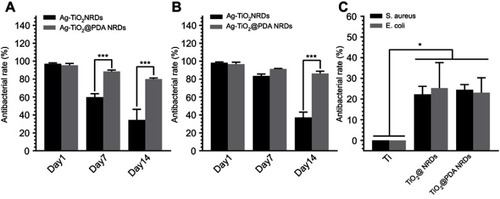
Figure 5 Protein leakage analysis and cytotoxicity evaluation in vitro. (A) Concentration of leaked protein in the supernatant of various groups; (B) cytotoxicity level of various surfaces by CCK-8 test. The error bars indicate means ± standared deviations: *p<0.05, ** p<0.01, and ***p<0.001.
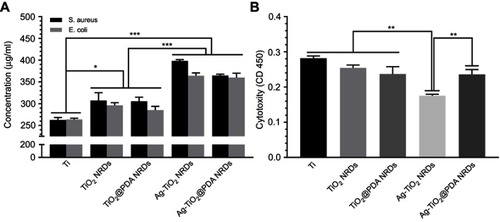
Figure 6 Cell morphology in vitro. (A, B) FE-SEM cell morphology of mouse calvarial cells (MC3T3-E1) cells cultured on various surfaces for 24 hrs (scale bars =200 [A] and 10 [B] μm); (C) fluorescent images of MC3T3-E1 cells cultured on various surfaces for 24 hrs with phalloidion (green) and DAPI (blue) (scale bars =100 μm).
![Figure 6 Cell morphology in vitro. (A, B) FE-SEM cell morphology of mouse calvarial cells (MC3T3-E1) cells cultured on various surfaces for 24 hrs (scale bars =200 [A] and 10 [B] μm); (C) fluorescent images of MC3T3-E1 cells cultured on various surfaces for 24 hrs with phalloidion (green) and DAPI (blue) (scale bars =100 μm).](/cms/asset/05ce9d27-93eb-4eb8-b789-6674e377332e/dijn_a_12190890_f0006_c.jpg)
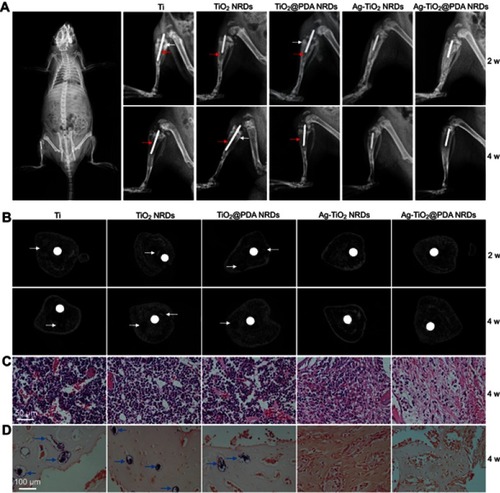
Figure 7 Implant infection model in vivo. (A) X-ray examination of the osteomyelitis model implanted with Ti rod 1 hr after surgery (left panel) and different kinds of rods at 2 weeks and 4 weeks (right panel), red arrows indicate osteolysis, white arrows indicate periosteal reaction; (B) cross-sectional images of micro-CT of different samples at 2 weeks and 4 weeks, white arrows indicate sequestrum; (C) H&E stain of different samples at 4 weeks (scale bars =50 μm); (D) gram stain of different samples at 4 weeks (scale bars =100 μm), blue arrows indicate MRSA colonies.