Figures & data
Table 1 Scoring system of arrhythmia
Figure 1 Plasma drug concentration–time curve (Group A: intragastric ligustrazine; Group B: transdermal ligustrazine ethosome patch; Group C: conventional transdermal ligustrazine patch).
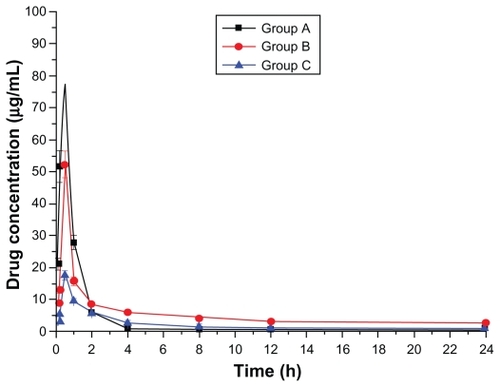
Figure 2 Drug concentration–time curve of the heart (Group A: intragastric ligustrazine; Group B: transdermal ligustrazine ethosome patch; Group C: conventional transdermal ligustrazine patch).
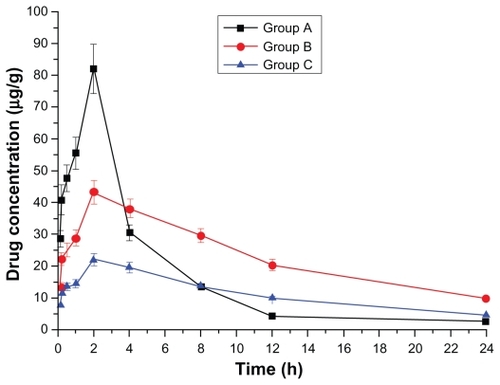
Figure 3 Drug concentration–time curve of the liver (Group A: intragastric ligustrazine; Group B: transdermal ligustrazine ethosome patch; Group C: conventional transdermal ligustrazine patch).

Figure 4 Drug concentration–time curve of the spleen (Group A: intragastric ligustrazine; Group B: transdermal ligustrazine ethosome patch; Group C: conventional transdermal ligustrazine patch).
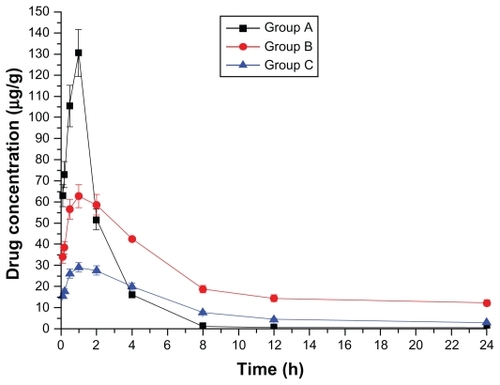
Figure 5 Drug concentration–time curve of the lung (Group A: intragastric ligustrazine; Group B: transdermal ligustrazine ethosome patch; Group C: conventional transdermal ligustrazine patch).
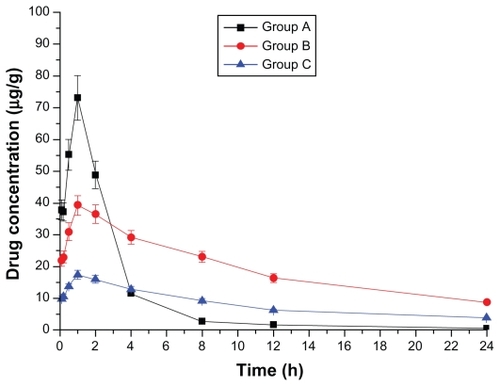
Figure 6 Drug concentration–time curve of the kidney (Group A: intragastric ligustrazine; Group B: transdermal ligustrazine ethosome patch; Group C: conventional transdermal ligustrazine patch).
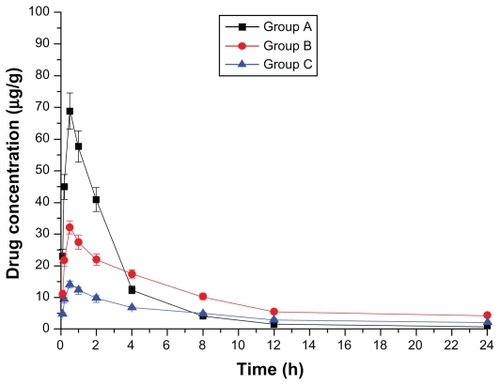
Figure 7 Drug concentration–time curve of the brain (Group A: intragastric ligustrazine; Group B: transdermal ligustrazine ethosome patch; Group C: conventional transdermal ligustrazine patch).
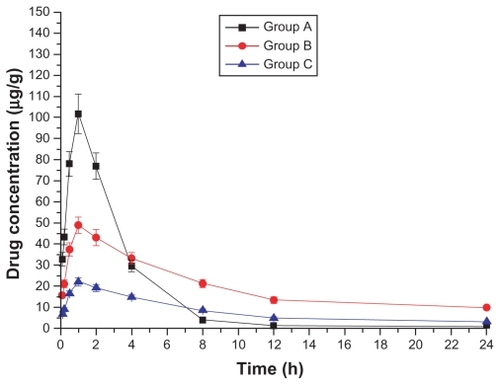
Figure 8 Drug concentration–time curve of the muscle (Group A: intragastric ligustrazine; Group B: transdermal ligustrazine ethosome patch; Group C: conventional transdermal ligustrazine patch).
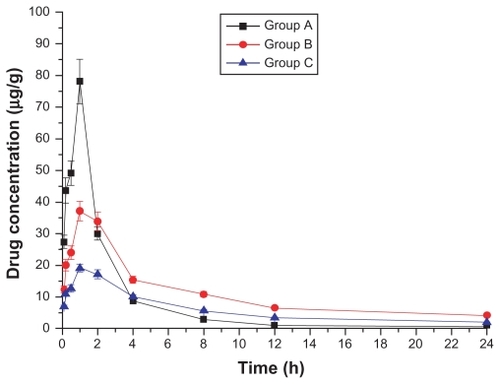
Table 2 Pharmacokinetics parameters of three groups
Table 3 The peak concentration of ligustrazine in various tissues (μg/mL or μg/g)
Figure 9 Comparison of area under the drug concentration–time curve (AUC) in various tissues of Group A, B, and C (Group A: intragastric ligustrazine; Group B: transdermal ligustrazine ethosome patch; Group C: conventional transdermal ligustrazine patch).
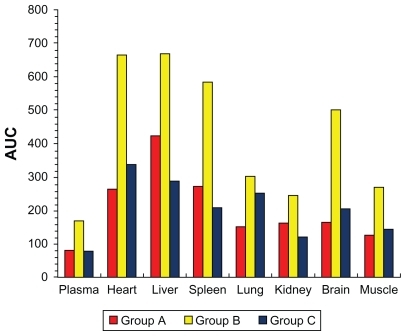
Table 4 Hemorheological indices
Table 5 Effects of ligustrazine and IP on reperfusion arrhythmia in anesthetized rats
Table 6 Effects of ligustrazine and IP on arrhythmia scores and myocardial infarction scope in anesthetized rats