Figures & data
Figure 1 Scanning electron microscopy (SEM) representative images of the generated AuNPs deposited on Si surface. (A) 50 nm AuNPs and (B) 20 nm AuNPs.
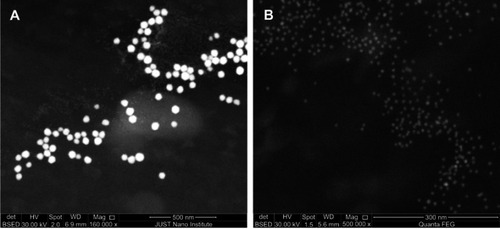
Figure 2 Size distribution of AuNPs as determined by dynamic light scattering (DLS). (A) 50 nm AuNPs and (B) 20 nm AuNPs. X-axis shows the particles diameter, and the Y-axis represents the nanoparticles size as measured by intensity.
Abbreviations: AuNPs, gold nanoparticles; Diam, diameter.
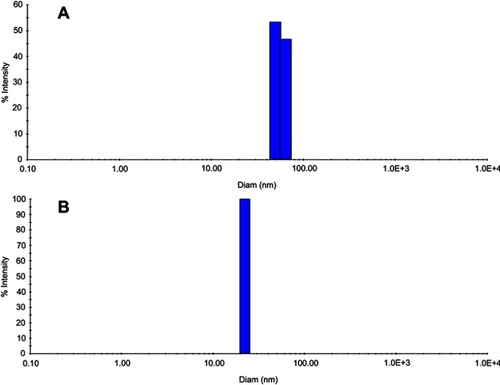
Figure 3 The zeta potential (ζ) distribution of the generated AuNPs.
Abbreviation: AuNPs, gold nanoparticles.
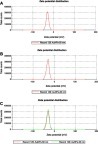
Table 1 Effects of AuNPs treatment on prostate weight/body weight ratio, prostate epithelial thickness and serum of DHT and testosterone levels
Figure 4 Effect of AuNPs treatment on the histomorphological changes of prostate sections (hematoxylin staining; magnification, ×100). Control group shows no histological alteration in the prostate gland. BPH group exhibit more proliferation in the glandular epithelial and stromal area with several papillary projections into the lumen. BPH +20 nm AuNPsgroup but not BPH +50 nm AuNPs show marked reduction in the epithelial hyperplasia, and the intraluminal papillary folds induced by testosterone.
Abbreviations: BPH, benign prostatic hyperplasia; AuNPs, gold nanoparticles.
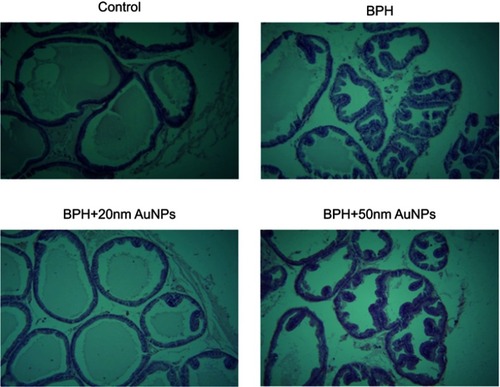
Figure 5 Effect of AuNPs treatment on the prostatic tissue level of TGFβ1. Data represent the mean ± SEM.*P<0.05 compared to the control group.
Abbreviations: BPH, benign prostatic hyperplasia; AuNPs, gold nanoparticles; TGF-β1, transforming growth factor-β1.
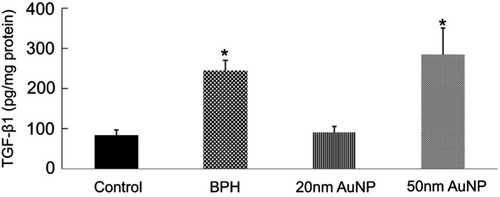
Figure 6 Effect of AuNPs treatment on the prostatic tissue level of VEGF-A. Data represent the mean ± SEM.*P<0.05 compared to the control group. #P<0.05 compared to the BPH group.
Abbreviations: BPH, benign prostatic hyperplasia; AuNPs, gold nanoparticles; VEGF-A, vascular endothelial growth factor-A.
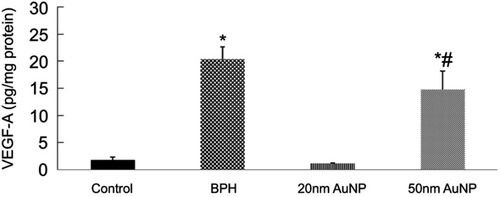
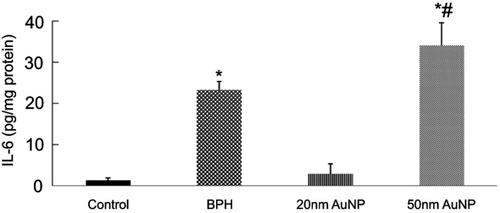
Figure 7 Effect of AuNPs treatment on the prostatic tissue level of IL-6. Data represent the mean ± SEM.*P<0.05 compared to the control group. #P<0.05 compared to the BPH group.
Abbreviations: BPH, benign prostatic hyperplasia; AuNPs, gold nanoparticles; IL-6, interleukin-6.