
Figures & data
Table 1 Different bacterial treatments and irradiation groups used in the study
Figure 1 (A) UV–vis absorbance spectra of CNTs, MG, and MGCNTs. (B) HRTEM micrograph of MGCNTs.
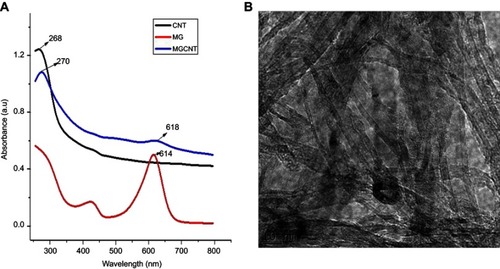
Figure 2 FTIR spectral analysis for the functional groups present in the CNTs, MG, and MGCNTs.
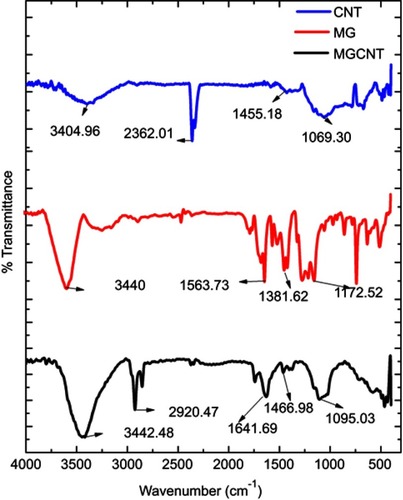
Table 2 MG release kinetics and correlation coefficient values from the Korsmeyer–Pappas kinetics model
Figure 3 (A) Release of malachite green from CNTs at 37°C and pH 7.4. Uptake of malachite green and MGCNTs by (B) P. aeruginosa and (C) S. aureus. (D) The log10 reductions of P. aeruginosa and S. aureus after treatment with CNTs, MG, and MGCNTs. Non-irradiated and irradiated cells are represented by (L−) and (L+), respectively. Asterisks (***) represent the statistical significance between the respective dark control and the free dye and nanocomposite (P-value <0.001).
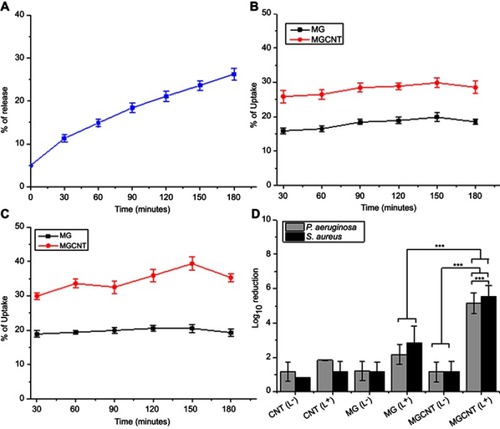
Figure 4 (A) Total reactive oxygen species produced in P. aeruginosa and S. aureus after photoinactivation. (B) Percentage of protein leakage from cells after aPDT. (C) Lipid peroxides formed in P. aeruginosa and S. aureus after aPDT. (D) Inhibition of biofilms of P. aeruginosa and S. aureus. Non-irradiated and irradiated cells are represented by (L−) and (L+), respectively. Asterisks (***) represent the statistical significance between the respective dark control and the free dye and nanocomposite (P-value<0.001).
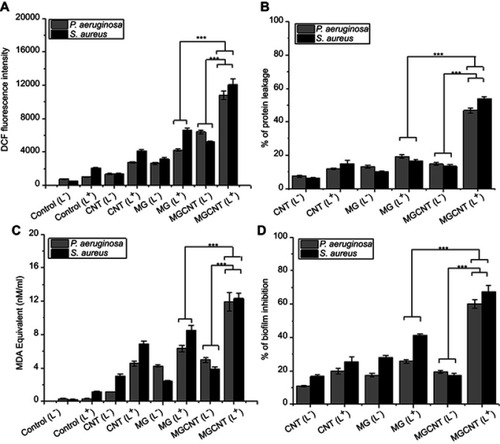
Figure 5 (A) Reduction in the cell viability of P. aeruginosa and S. aureus after aPDT treatment. (B) Reduction in exopolysaccharides of P. aeruginosa and S. aureus after aPDT. Non-irradiated and irradiated cells are represented by (L−) and (L+), respectively. Asterisks (***) represent the statistical significance between the respective dark control and the free dye and nanocomposite (P-value <0.001).
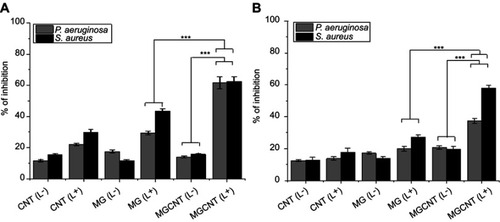
Figure 6 Confocal laser scanning microscopy images of biofilms of (A) P. aeruginosa and (B) S. aureus. (a) and (e) comprise non-irradiated and irradiated biofilms; (b) (c), and (d) are biofilms incubated in the dark and treated with CNTs, MG, and MGCNT, respectively; (f), (g), and (h) comprise biofilms treated with CNTs, MG, and MGCNTs, respectively, and irradiated.
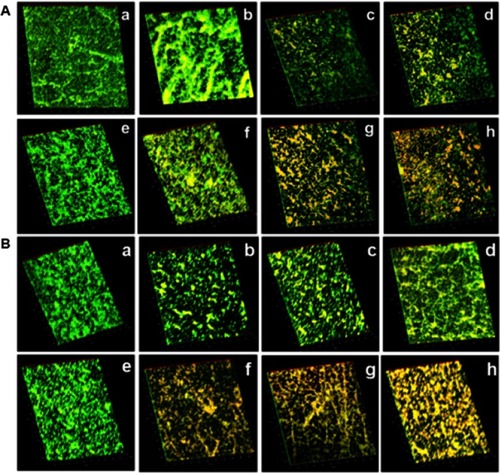
Table S1 Antimicrobial photodynamic effect of MGCNT with different time periods of light irradiation