Figures & data
Table 1 Primers used in RT-PCR
Figure 1 The characterization and cytotoxicity of the Se@SiO2 nanocomposites. (A) XRD pattern of the solid Se@SiO2 nanocomposites and the standard hexagonal phase of Se (JCPDS card no: 65-1876). (B) Low- and (C) high-magnification TEM image of the solid Se@SiO2 nanocomposites. (D) Medium-magnification images of the porous Se@SiO2 nanocomposites. (E) The cell viability of BMSCs treated with different concentrations of the porous Se@SiO2 nanocomposites for 24 hrs. Data are expressed as means ± SDs (n=3). (F) The cumulative release kinetics of Se from the porous Se@SiO2 nanocomposites in PBS at 37°C and pH 7.4.
Abbreviations: TEM, transmission electron microscopy; XRD, X-ray diffractometer.
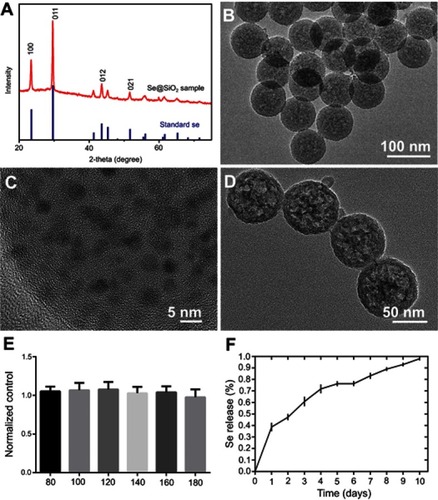
Figure 2 Porous Se@SiO2 nanocomposite has a powerful capacity to promote BMSCs migration. (A and B) The porous Se@SiO2 nanocomposite can promote migration of BMSCs, which was demonstrated by transwell assays. BMSCs that passed through the membrane were detected with crystal violet staining. (C) The gene expression of SDF-1 in the blank group and Se@SiO2 group was compared using RT-PCR. ***p<0.05, blank group vs Se@SiO2 group. Data are expressed as means ± SDs (n=3). (D) The gene expression of CXCR4 in the blank group and Se@SiO2 group. **p<0.05, blank group vs Se@SiO2 group. All data were expressed as mean ± SDs (n=3).
Abbreviation: BMSCs, bone marrow mesenchymal stem cells.
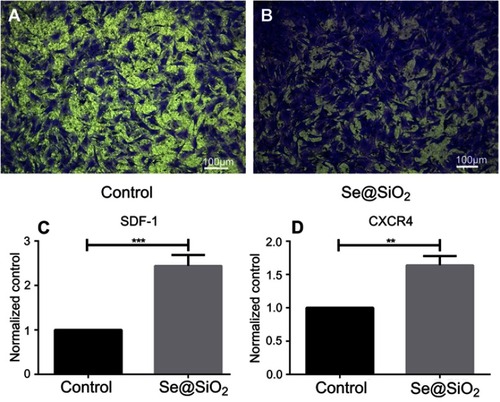
Figure 3 Porous Se@SiO2 nanocomposite can reduce intracellular ROS formation and protect BMSCs against hydrogen peroxide-induced apoptosis. (A–D) The production of ROS induced by H2O2 in the H2O2 group was higher than that in the H2O2+ Se@SiO2 group, and the porous Se@SiO2 nanocomposite at a concentration of 160 µg/mL could decrease the level of intracellular ROS more than porous Se@SiO2 nanocomposite at a concentration of 80 µg/mL. (E–H) Cell apoptosis was detected by flow cytometry analysis after staining with Annexin V and PI. (I–T) Staining BMSCs with DAPI and TUNEL. (U) Staining of BMSCs with ROS and DAPI, ***p<0.05, blank group vs H2O2 group, **p<0.05, H2O2 group vs H2O2+ Se@SiO2 group (80 μg/mL), **p<0.05, H2O2 group vs H2O2+ Se@SiO2 group (160 μg/mL). Data are expressed as means ± SDs (n=3). (V) The bar graph of early apoptosis rate (%), ***p<0.05, blank group vs H2O2 group, **p<0.05, H2O2 group vs H2O2+ Se@SiO2 group (80 μg/mL), ***p<0.05, H2O2 group vs H2O2+ Se@SiO2 group (160 μg/mL). Data are expressed as means ± SDs (n=3). (W) The bar graph of late apoptosis rate (%), *p<0.05, blank group vs H2O2 group, **p<0.05, H2O2 group vs H2O2+ Se@SiO2 group (80 μg/mL), **p<0.05, H2O2 group vs H2O2+ Se@SiO2 group (160 μg/mL). Data are expressed as means ± SDs (n=3). (X) Statistical analysis of TUNEL staining. The numbers of TUNEL-positive cells of all cells was calculated under a fluorescent microscope. ***p<0.05, blank group vs H2O2 group, *p<0.05, H2O2 group vs H2O2+ Se@SiO2 group (80 μg/mL), ***p<0.05, H2O2 group vs H2O2+ Se@SiO2 group (160 μg/mL). All data are expressed as means ± SDs (n=3).
Abbreviations: ROS, reactive oxygen species; DCF, dichlorofluorescein; DAPI, 4',6-diamidino-2-phenylindole; FITC, fluorescein isothiocyanate; PI, propidium iodide.
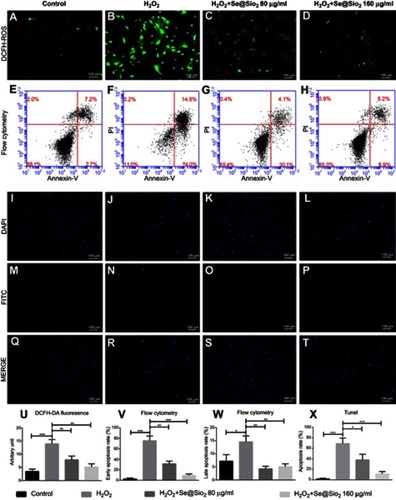
Figure 4 Porous Se@SiO2 nanocomposite can promote osteogenic differentiation of BMSCs and protect BMSCs against H2O2-induced inhibition of osteogenic differentiation through the BMP/Smad signaling pathway. (A–H) The ALP activity of each group was measured after 7 days. (I–P) Calcium deposits of each group were measured by Alizarin Red staining after 21 days. (Q–T) After 7 days of osteogenic induction, the genes of each group related to osteogenic differentiation of BMSCs were analyzed by RT-PCR. (Q) Porous Se@SiO2 nanocomposite increased the expression of Runx2. ***p<0.05, blank group vs Se@SiO2 group, **p<0.05, H2O2 group vs H2O2+ Se@SiO2 group. (R) Porous Se@SiO2 nanocomposite increased the expression of OCN. ***p<0.05, blank group vs Se@SiO2 group, ***p<0.05, H2O2 group vs H2O2+ Se@SiO2 group. (S) Porous Se@SiO2 nanocomposite increased the expression of BMP-2. **p<0.05, blank group vs Se@SiO2 group, *p<0.05, H2O2 group vs H2O2+ Se@SiO2 group. (T) Porous Se@SiO2 nanocomposite increased the expression of Smad1. ***p<0.05, blank group vs Se@SiO2 group, *p<0.05, H2O2 group vs H2O2+ Se@SiO2 group. (U and V) Total proteins from four groups were extracted, and we analyzed the levels of Smad1/5/9 and pSmad1/5/9 by Western blot. β-Actin was used as a loading control. (W) Expression of Smad1/5/9 was determined by Western blotting. There was no significant difference of blank group vs Se@SiO2 group and H2O2 group vs H2O2+ Se@SiO2 group, #p>0.05. (X) Expression of pSmad1/5/9 was determined by Western blotting. **p<0.05, blank group vs Se@SiO2 group, **p<0.05, H2O2 group vs H2O2+ Se@SiO2 group. All data are expressed as means ± SDs (n=3).
Abbreviations: ALP, alkaline phosphatase; ARS, Alizarin Red s.
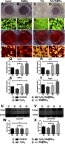
Figure 5 Porous Se@SiO2 nanocomposite promoted the translocation of pSmad1/5/9 from the cytoplasm to the nucleus. (A–X) Immunofluorescence analysis of pSmad1/5/9 in four different groups.
Abbreviation: DAPI, 4',6-diamidino-2-phenylindole.
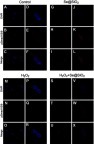
Figure 6 Radiographs at 2, 4 and 6 weeks were taken after the operation. (A–F) The bridging callus formation was observed at 2 weeks after operation in the Se@SiO2 group. The cortical gap of the Se@SiO2 group disappeared at 4 weeks postoperatively. On the other hand, bridging callus formation in the blank group was observed at 4 weeks, and there was no bone union at 4 weeks. All data are expressed as means ± SDs (n=3).
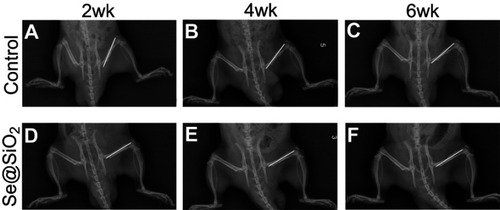
Figure 7 The results of micro-CT of fracture callus at 6 weeks after operation. (A–F) Representative images of micro-CT of the Se@SiO2 group and blank group. (G) The BMD was analyzed by micro-CT. *p<0.05, blank group vs Se@SiO2 group. (H) The BV/TV was analyzed by micro-CT. *p<0.05, blank group vs Se@SiO2 group.
Abbreviations: CT, computed tomography; BMD, bone mineral density; BV, bone volume; TV, tissue volume.
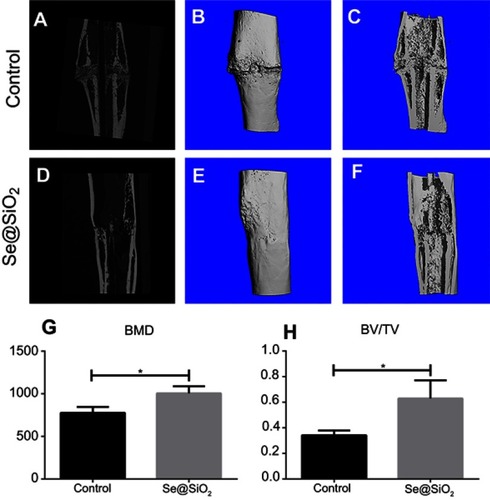
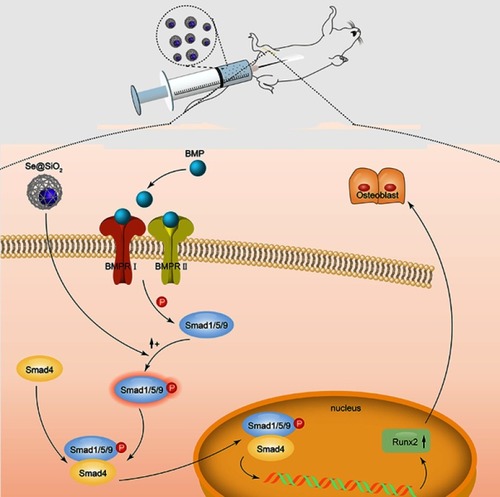
Figure 8 Mechanism of porous Se@SiO2 nanocomposites to promote osteogenic differentiation of BMSCs and protect BMSCs against H2O2-induced inhibition of osteogenic differentiation.