Figures & data
Table 1 Size and zeta potential of polystyrene carboxylate fluorescent microspheres
Figure 1 (A) Parallel plate flow chamber apparatus, used for in vitro adhesion experiments, consisting of: 1, a syringe pump; 2, a syringe with particles suspended in solution; 3, inlet tubing; 4, parallel plate flow chamber; 5, outlet tubing; 6, microscope; 7, digital camera; and 8, computer. (B) Images depicting an epifluorescent microscope with setup of the system, and (C) the parallel plate flow chamber with tubing network installed over the stage of the microscope.
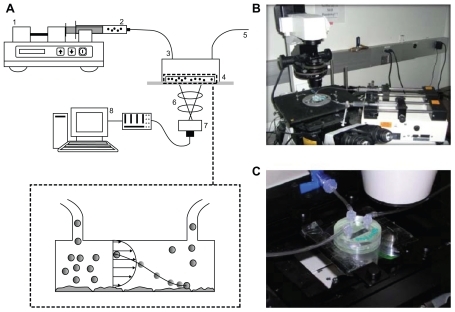
Figure 2 (A) Fully connected neural network with two hidden layers. (B) Typical scheme of a neuron and its activity:
.
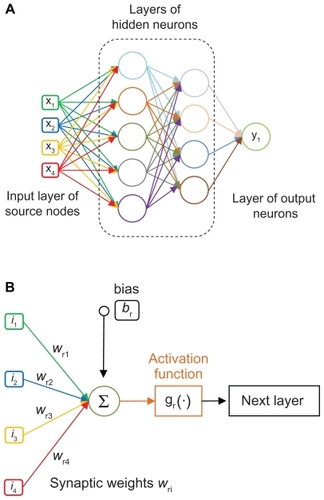
Figure 3 Number of particles (ns) adhering per unit area in a parallel plate flow chamber, under different flow conditions (shear rate to the wall [S]), as a function of particle diameter d. Single marks represent the experimental data, as from .
![Figure 3 Number of particles (ns) adhering per unit area in a parallel plate flow chamber, under different flow conditions (shear rate to the wall [S]), as a function of particle diameter d. Single marks represent the experimental data, as from Table S1.](/cms/asset/521b0eeb-a99b-4df9-b960-ada9c28519b7/dijn_a_20283_f0003_c.jpg)
Figure 4 (A) The ns(d) relationship as predicted from ANN231 for particle diameters not tested in the experiments. (B) The ns(d) relationship as predicted from ANN231 for shear rates (S) not tested in the experiments. (C) Root mean squared error of the test set of data for the ANN231.
Note: The red arrow depicts the minimum (2.6 × 10⁶ iterations).
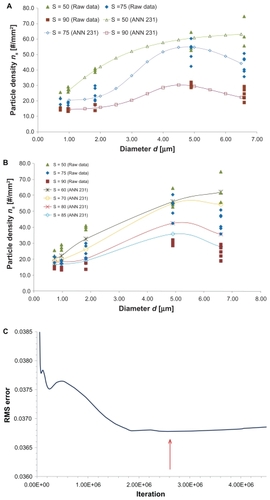
Figure 5 (A) The ns(d) relationship as predicted from ANN2321 for particle diameter not tested in the experiments. (B) The ns(d) relationship as predicted from ANN2321 for shear rates S not tested in the experiments. (C) Root mean squared error of the test set of data for the ANN2321.
Note: The red arrow depicts the minimum (1.75 × 10⁶ iterations).
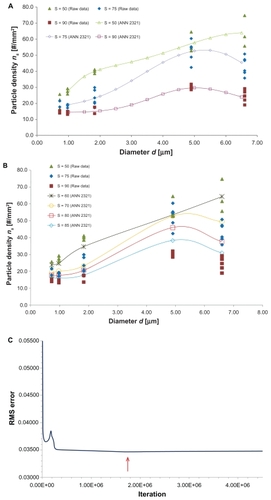
Table 2 Root mean squared error for learning and test sets of the two ANNs used
Figure 6 The optimal diameter dopt as a function of S for the ANN231 and ANN2321.
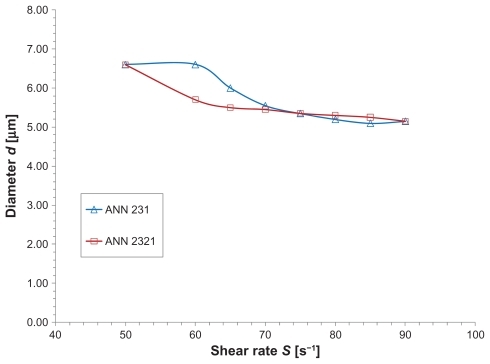
Figure S1 Root mean squared error of the learning set of data for ANN231.
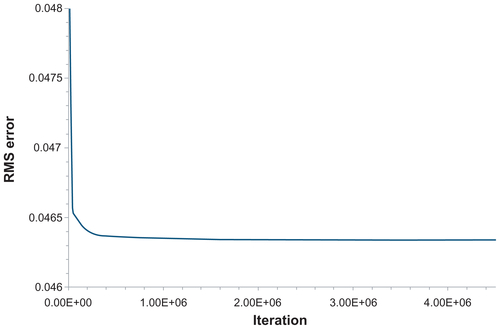
Figure S2 Root mean squared error of the learning set of data for ANN2321.
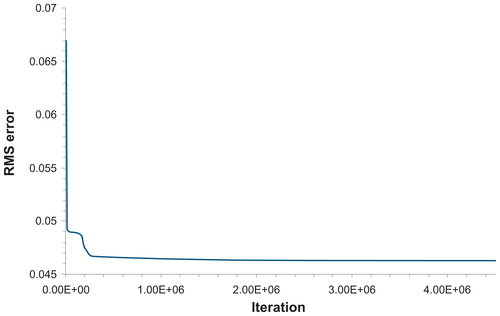
Table S1 Experimental data for the number of particles ns adhering per unit area in a parallel plate flow chamber
Table S2 Values for mean and standard deviation of number of particles (ns) adhering per unit area in parallel plate flow chamber experiments