Figures & data
Figure S1 The standard curve of doxorubicin at (A) pH 5.4 and (B) pH 7.4.
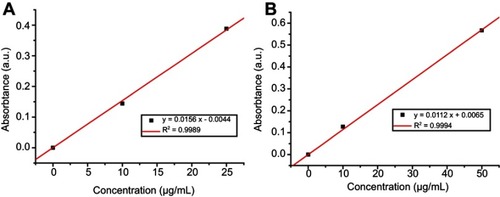
Figure 1 Characterization of nanofibers. (A) Scanning electron microscopy pictures and diameter distribution of (A) chitosan/polyvinyl alcohol (CP), (B) CP/MoS2, and (C) CP/MoS2/doxorubicin nanofibers.
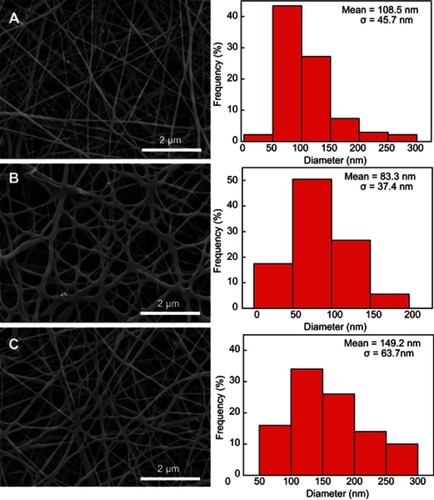
Figure 2 Characterization of crosslinked nanofibers. (A) Scanning electron microscopy pictures and diameter distribution of GA-crosslinked (A) chitosan/polyvinyl alcohol (CP), (B) CP/MoS2, and (C) CP/MoS2/doxorubicin nanofibers.
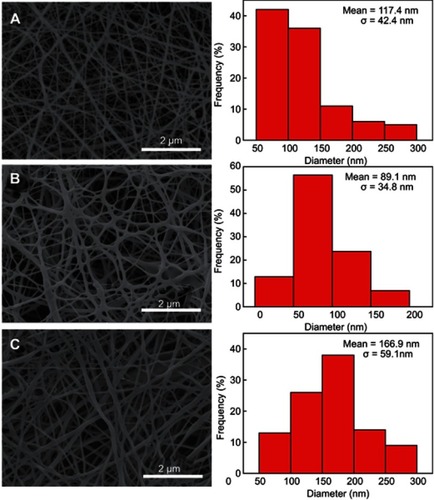
Figure S2 Transmission electron microsopy image of MoS2 nanosheets.
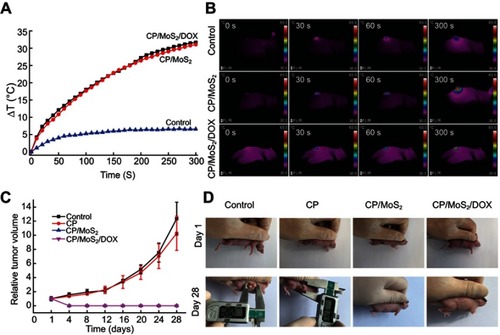
Figure 3 In vitro photothermal performance of nanofibers. (A) Power density-related temperature changes (△T) of CP/MoS2 nanofibers during 300 s of irradiation by 808 nm near-infrared laser. (B) Thermal images of CP/MoS2 nanofibrous mat at different time points corresponding to (A). (C) Steady state heating curve and heat transfer time constant of CP/MoS2 nanofibers (power density 1 W/cm2, 5 min; R=0.997, τs=225.7 s). (D) 808 nm laser-induced recycling photothermal ability of CP/MoS2 nanofibers.Abbreviation: CP, chitosan/polyvinyl alcohol.
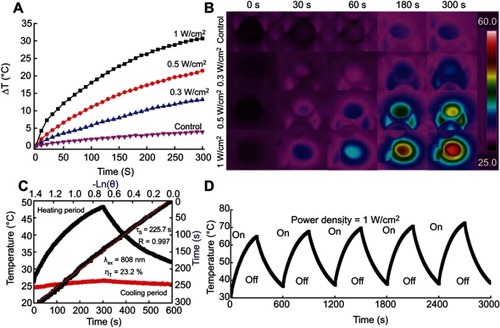
Figure S3 Ultraviolet–visible–near-infrared spectrum of (A) CP/MoS2 nanofibers and (B) DOX.Abbreviation: CP, chitosan/polyvinyl alcohol.
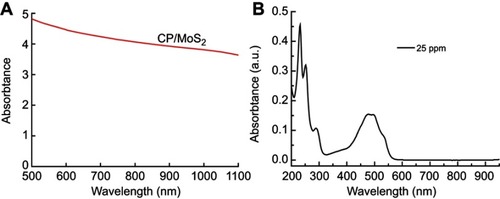
Figure S4 (A) In vivo photothermal performance of CP nanofibrous mat. (B) In vivo thermal images of mice corresponding to (A).Abbreviations: △T, temperature increase; CP, chitosan/polyvinyl alcohol.
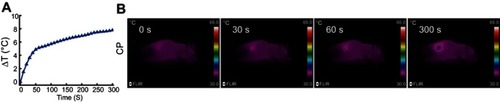
Figure 4 Doxorubicin release from CP/MoS2 nanofibrous mat at different pH with (T=54 °C) or without (T=37 °C) near-infrared irradiation (1 W/cm2). Abbreviation: CP, chitosan/polyvinyl alcohol.
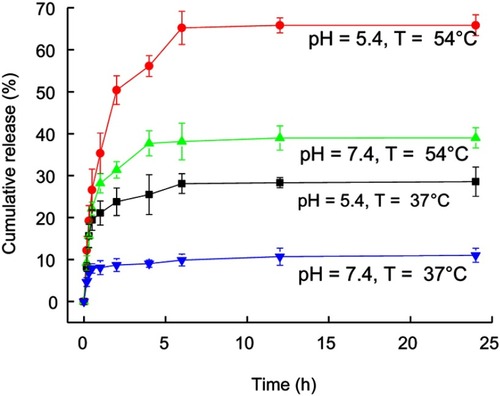
Figure 5 In vitro cytocompatibility and hemocompatibility assays of crosslinked nanofibers. (A) Proliferation viability of L929 cells on cell culture plate, CP, and CP/MoS2 nanofibers after 24 h, 48 h, and 72 h of culture. (B) Hemolytic percentage (HP) of mRBCs treated with CP and CP/MoS2 nanofibers. Inset images are the centrifuged mRBCs after 2 h of incubation with (1) water, (2) saline, (3) CP, and (4) CP/MoS2 nanofibers. (C) Scanning electron microscopy micrographs of L929 cells cultured on CP and CP/MoS2 nanofibers after 24 h, 48 h, and 72 h culture. Abbreviations: CP, chitosan/polyvinyl alcohol; OD, optical density; HP, hemolytic percentage; mRBC, mouse red blood cell.
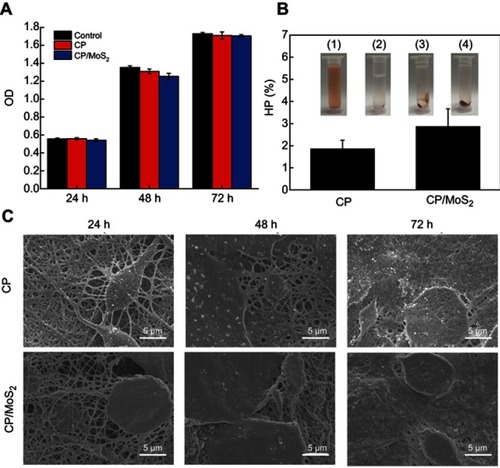
Figure S5 (A) The viability of L929 cells after incubation with saline, CP, and CP/MoS2 nanofibers. (B–D) Dead/Live phase contrast images of L929 cells after treatment with (B) saline, (C) CP, and (D) CP/MoS2 nanofibers for 24 h. Abbreviation: CP, chitosan/polyvinyl alcohol.
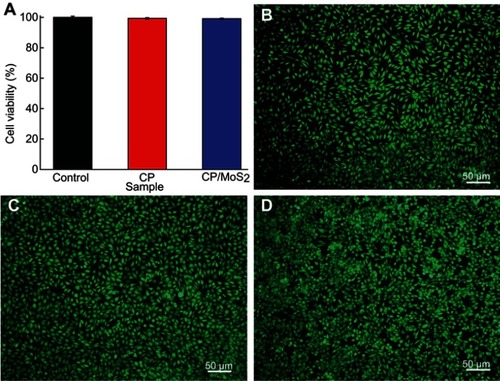
Figure 6 In vivo biocompatibility assays of crosslinked nanofibers. (A) Body weight evolution curves of healthy KM mice and KM mice with subcutaneous CP/MoS2 nanofiber embedding. (B) Blood biochemistry parameter. (C) Biodistribution of Mo element. (D) H&E staining images of KM mice with subcutaneous CP/MoS2 nanofiber embedding.Abbreviations: ALT, alanine aminotransferase; AST, aspartate aminotransferase; CP, chitosan/polyvinyl alcohol; KM, Kunming; TB, total bilirubin.
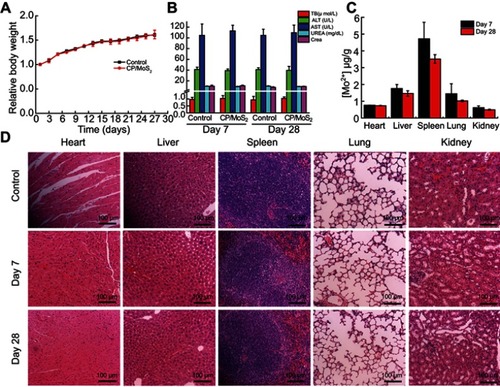
Figure S7 Changes of hemoglobin (HB), hematocrit (HCT), platelet (PLT), mean corpuscular volume (MCV), mean corpuscular hemoglobin (MCH), mean corpuscular hemoglobin concentration (MCHC), red blood cell count (RBC), red cell distribution width (RDW), and white blood cell count (WBC) of healthy Kunming mice (control) and mice treated with CP/MoS2 nanofibrous mat for 7 and 28 days (mean±SD, n=3). Abbreviation: CP, chitosan/polyvinyl alcohol.
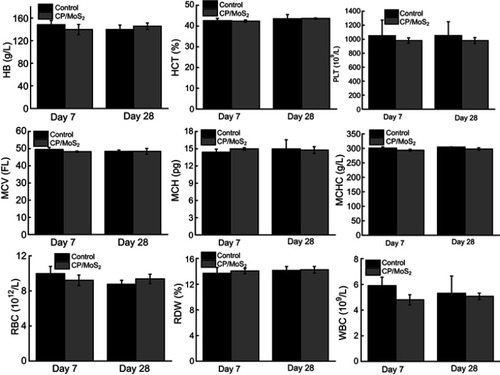
Figure 7 In vitro therapeutic efficacy of crosslinked nanofibers. (A) In vitro photothermal therapy and chemotherapy of CP, CP/DOX, and CP/MoS2 and CP/MoS2/DOX nanofibers. (B–E) Dead/Live staining of HT29 cells treated with (B) control, (C) CP/DOX+NIR, (D) CP/MoS2+NIR, and (E) CP/MoS2/DOX+NIR.Abbreviations: CP, chitosan/polyvinyl alcohol; DOX, doxorubicin; NIR, near infrared.
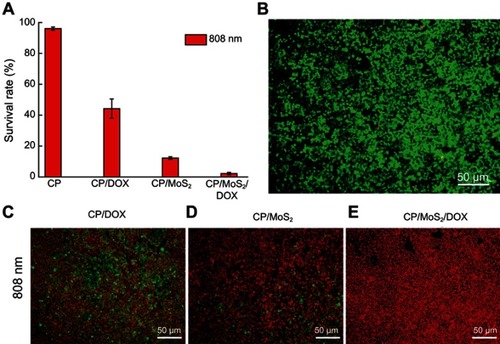
Figure S6 Phase contrast microscopic (A, C) and fluorescent (B, D) photographs of HT29 cells treated with saline (A, B) and CP/MoS2/DOX nanofibers (C, D). Abbreviation: CP, chitosan/polyvinyl alcohol.
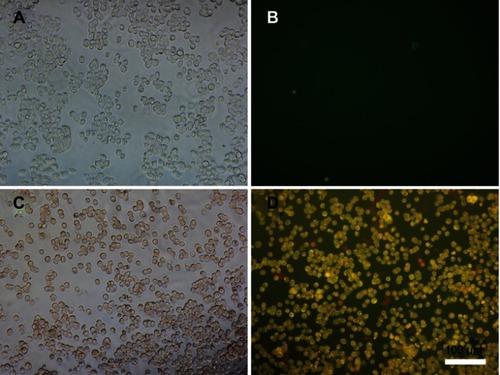
Figure 8 In vivo therapeutic efficacy of crosslinked nanofibers. (A) In vivo photothermal performance of CP/MoS2 nanofibrous mat (control: mice without treatment). (B) In vivo thermal images of mice receiving different treatments as noted. (C) Postoperative tumor volume of mice receiving different treatments as noted. (D) Representative photographs of HT29 tumor-bearing mice corresponding to (C).Abbreviations: △T, temperature increase; CP, chitosan/polyvinyl alcohol; DOX, doxorubicin.