Figures & data
Figure 1 Characterization of AHPP/OVA and surface cationic polymer modified AHPP/OVA. (A) Schematic of OVA-loaded surface cationic polymer modified AHPP/OVA nanoparticles. (B) Loading efficiency of AHPP/OVA and surface cationic polymer modified AHPP/OVA nanoparticle dispersions stored at 37°C. (C) Zeta-potential and particle size of AHPP/OVA, CS-AHPP/OVA, PEI-AHPP/OVA, and εPL-AHPP/OVA. (D–G) SEM of AHPP/OVA, CS-AHPP/OVA, PEI-AHPP/OVA, and εPL-AHPP/OVA. Results were expressed as means ± SEM (n=3). a–b Bars with different superscripts differed significantly (P<0.05).
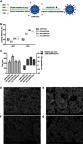
Figure 2 In vitro release and stability of AHPP/OVA and surface cationic polymer modified AHPP/OVA. (A) OVA release from the AHPP/OVA and surface cationic polymer modified AHPP/OVA incubated in deionized water (pH=7.0) for 35 days. (B) PDI of AHPP/OVA, CS-AHPP/OVA, PEI-AHPP/OVA, and εPL-AHPP/OVA dispersions stored at 37°C. (C) Changes in the polymerization of AHPP/OVA, CS-AHPP/OVA, PEI-AHPP/OVA and εPL-AHPP/OVA dispersions stored at 37°C. Results were expressed as means ± SEM (n=3).
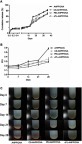
Figure 3 Antigen-specific CD4+/CD8+ T cell activation. (A) Effects of drugs on splenic lymphocyte proliferation. (B) Ratio of CD3+CD4+ to CD3+CD8+ splenocytes harvested from vaccinated mice re-stimulated with OVA. Mice (n=4) were immunized using different vaccine formulations. a–e Bars with different superscripts differed significantly (P<0.05).
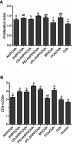
Figure 4 Cytokine secretion. (A) IL-4, IL-6, (B) IFN-γ, and TNF-α levels in serum 35 days after final immunization were measured by ELISA. Mice (n=4) were immunized using different vaccine formulations. a–e Bars with different superscripts differed significantly (P<0.05).
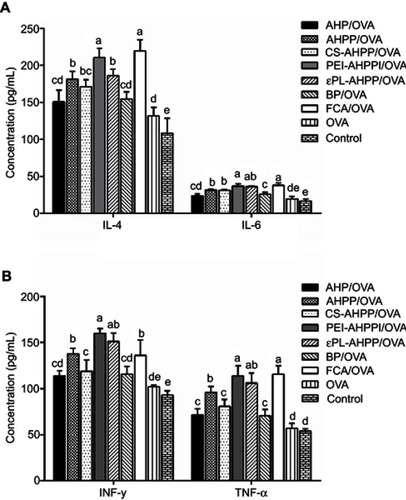
Figure 5 (A) OVA-specific IgG levels at the indicated time points. (B) Th2-associated isotype IgG1 levels, Th1-associated isotype IgG2a levels, and ratio of IgG2a/IgG1 at day 35 after final vaccination. Mice (n=4) were immunized using different vaccine formulations. a–f Bars with different superscripts differed significantly (P<0.05).
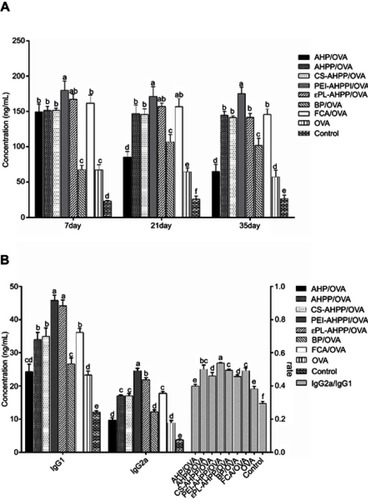
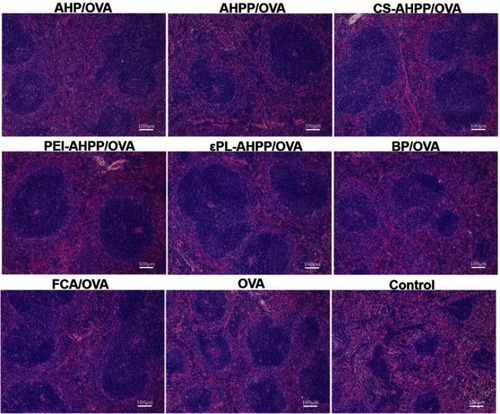
Figure 6 HE staining of spleens of immunized mice at day 35 after final vaccination. Scale bar represents 100 nm.