Figures & data
Figure 1 Schematic diagram for the synthesis of NaYF4:Yb,Er@PE3@Fe3O4 upconversion nanoprobes and subsequent use in photothermal therapy.
Abbreviations: HSP, heat shock protein; MRI, magnetic resonance imaging; UCL, upconversion luminescence.
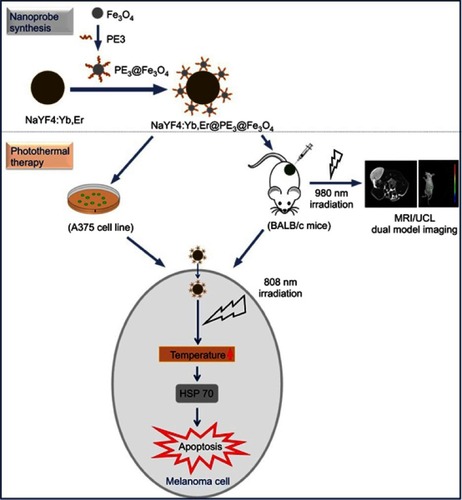
Table 1 PCR primers
Figure 2 Characterization of the superparamagnetic NaYF4:Yb,Er@PE3@Fe3O4 upconversion nanoprobes. (A) Scanning electron microscopy image revealing cubic morphology of these nanoprobes with a uniform diameter of ~50 µm. Scale bar, 100 µm. (B) Images of synthesized nanoprobes dispersed in an aqueous solution in the absence (left) and presence (right) of a neighboring magnet. (C) Upconversion emission spectra of synthesized nanoprobes under 980 nm laser excitation, with a major peak centered at 550 nm.
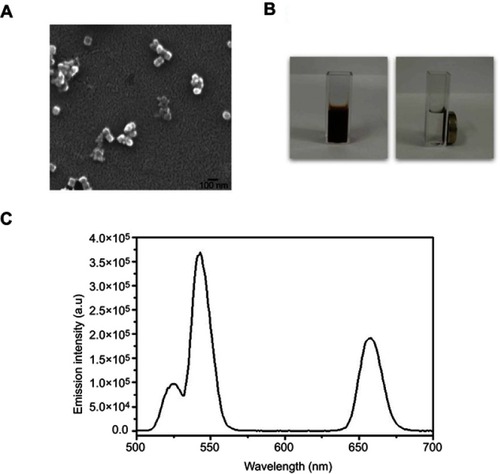
Table 2 Blood routine tests after in vivo administration of synthesized nanoprobes
Table 3 Blood biochemical tests after in vivo administration of synthesized nanoprobes
Table 4 Biodistribution of metal elements in organs of mice by inductively coupled plasma optical emission spectrometry analysis
Figure 3 Near-infrared (NIR) photothermal effects and upconversion luminescence (UCL) imaging in BALB/c mice. (A) Thermal imaging of BALB/c mice during NIR irradiation after intratumoral injection of NaYF4:Yb,Er@PE3@Fe3O4 nanoprobes. The black arrowhead indicates when irradiation ceased. (B) Changes of temperature at tumor site during NIR irradiation. The arrowhead indicates when NIR irradiation ceased. (C) In vivo UCL imaging after intratumoral injection of nanoprobes.
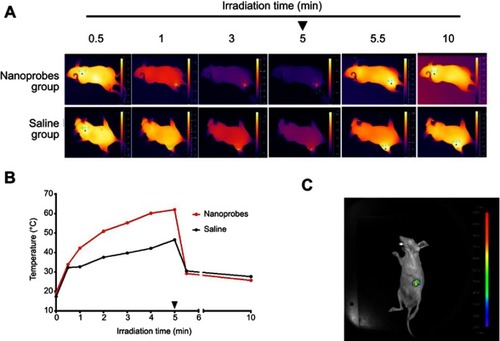
Figure 4 In vitro photothermal effects in A375 cells. (A) Confocal microscope image of cells treated with NaYF4:Yb,Er@PE3@Fe3O4 nanoprobes and stained with Prussian blue, indicating our nanoprobes were readily taken up by A375 cells. (B) Bright-field images of A375 cells treated with saline or nanoprobes, in the presence or absence of near-infrared (NIR) irradiation. The combination of nanoprobes with NIR irradiation led to overt cell death. This experiment was repeated three times. (C) MTT assay showing the viability of A375 cells treated with increasing concentrations of nanoprobes in the presence and absence of NIR irradiation (n=3). (D) Apoptotic and necrotic rates of A375 cells after photothermal treatment as revealed by flow cytometry. This experiment was repeated three times. (E) Expression of heat shock protein HSP70 was elevated with increasing concentrations of nanoprobes in the presence of NIR irradiation, on both mRNA and protein levels as revealed by semiquantitative PCR and western blot, respectively. This experiment was repeated three times.
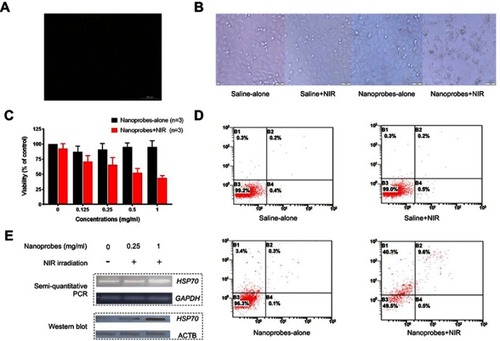
Figure 5 In vivo photothermal effects in tumor-bearing BALB/c mice. (A) Changes of mice body weights over the study (n=8). (B) Net changes in body weight by the end of the study in each group (day 10 versus day 0) (n=8). (C) Representative photographs of tumors in each treatment group over the study. (D) Tumor growth curves of each treatment group (n=8). Tumor sizes were normalized to their initial sizes (baseline) and expressed as fold-change over the latter. (E) H&E staining of major organs (heart, liver, spleen, lung, and kidney) in each treatment group. Naïve BALB/c mice were included as normal control. This experiment was repeated three times. *p<0.05, ***p<0.001, ****p<0.0001.
Abbreviation: NIR, near infrared.
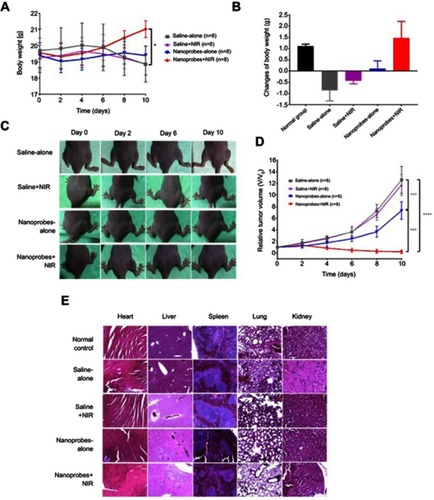
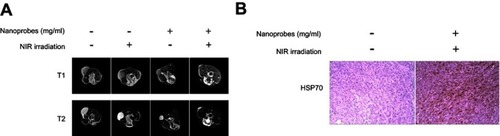
Figure 6 In vivo magnetic resonance imaging (MRI) scans and tumoral heat shock protein HSP70 expression. (A) Tumor-bearing BALB/c mice were intratumorally injected with saline or NaYF4:Yb,Er@PE3@Fe3O4 nanoprobes, followed by either near-infrared irradiation (NIR) irradiation or not. Five days later, both T1- and T2-weighted MRI scans were captured from each treatment group. (B) Immunohistochemical analysis of tumoral HSP70 expression in control mice and those receiving photothermal therapy. This experiment was repeated three times.