Figures & data
Table 1 Characteristics of various types of CS NPs
Figure 1 Characteristics of various CS NPs. (A) Size distributions of CS NPs and CS NPs-HA. a) CS NPs; b) CS NPs-HA. (B) An SEM image of CS NPs-HA. (C) Size distributions of sCS NPs and sCS NPs-HA. a) sCS NPs; b) sCS NPs-HA. (D) Cy3-labeled siRNA encapsulation efficiency of CS NPs and CS NPs-HA. A total of 0.5 μL of Cy3-labeled siRNA served as a control (CTRL); lane 1, 5.3 μL of CS NPs; lane 2, 5.3 μL of sCS NPs (containing 0.5 μL of Cy3-labeled siRNA); lane 3, 5.3 μL of CS NPs-HA; lane 4, 5.3 μL of sCS NPs-HA (containing 0.5 μL of Cy3-labeled siRNA); lane 5, 1 μL of Cy3-labeled siRNA was used as a control (CTRL); lane 6, 10.6 μL of CS NPs; lane 7, 10.6 μL of sCS NPs (containing 1 μL of Cy3-labeled siRNA); lane 8, 10.6 μL of CS NPs-HA; lane 9, 10.6 μL of sCS NPs-HA (containing 1 μL of Cy3-labeled siRNA). (E) In vitro stability of CS NPs. a) CS NPs; b) sCS NPs; c) CS NPs-HA; d) sCS NPs-HA (n=3).
Abbreviations: CS NPs, chitosan nanoparticles; CS NPs-HA, HA-modified chitosan nanoparticles; sCS NPs, chitosan nanoparticles loaded with siRNA; sCS NPsHA, HA-modified chitosan nanoparticles loaded with siRNA.
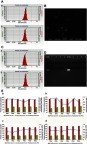
Figure 2 Cytotoxicity and proliferation of A549 cells treated with various NPs. (A) Cytotoxicity of CS NPs and CS NPs-HA (5, 10, 20, 40, 80 μg). No significant change was observed in the growth rate of L929 cells treated with different NPs until 96 h (n=3) (Two-way ANOVA). (B) Effects of sCS NPs-HA on the proliferation of A549 cells. This assay uncovered an obvious advantage: inhibition of the proliferation of A549 cells (0.26, 0.52, 0.78 μg).
Abbreviations: CS NPs, chitosan nanoparticles; CS NPs-HA, HA-modified chitosan nanoparticles; sCS NPs, chitosan nanoparticles loaded with siRNA; sCS NPsHA, HA-modified chitosan nanoparticles loaded with siRNA; Hiperfect, siRNA transfection; Anti-Bcl2 siRNA, naked siRNA.
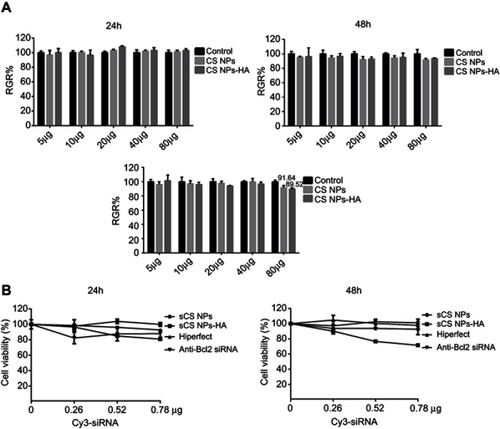
Figure 3 Efficiency of transfection of sCS NPs, sCS NPs-HA, and Cy3-labeled siRNA (Hiperfect transfection) into A549 cells at 24 hrs (A) and 48 hrs (B) (amounts of Cy3-labeled siRNA 2.6 μg) (n=3). a) Control, b) sCS NPs, c) sCS NPs-HA, and d) Cy3-labeled siRNA, e) statistical analysis of transfection rates. In comparison with the Cy3-labeled siRNA transfection group, the sCS NPs-HA group had higher transfection efficiency and the difference was statistically significant. ***P<0.001, ****P<0.0001 (one-way ANOVA (and nonparametric) and t-tests), ns means not statistical significance.
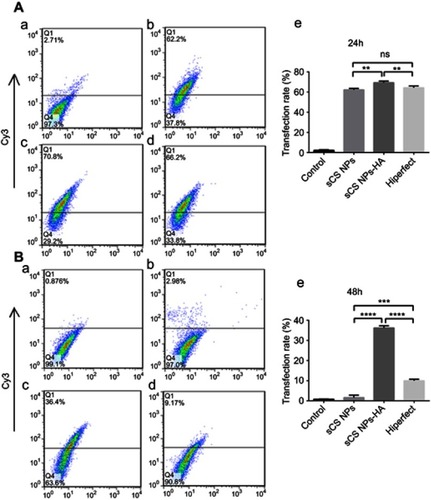
Figure 4 (A) Changes in the fluorescence intensity of sCS NPs-HA and receptor CD44 at different time points. Red, green, and blue fluorescence correspond to sCS NPs-HA, CD44, and nucleus, respectively (amounts of Cy3-labeled siRNA 0.52 μg). (B) CD44 expression changes over time. **P<0.01, ****P<0.0001 (one-way ANOVA (and nonparametric) and t-tests), ns means not statistical significance.
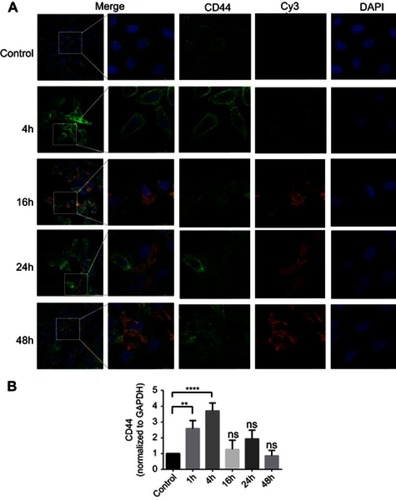
Figure 5 Effects of the Cy3-labeled siRNA loaded by NPs on the target gene (amounts of Cy3-labeled siRNA 0.52 μg). (A) Expression of the BCL2 protein in A549 cells, as determined by Western blotting and normalized to GAPDH expression at 48 hrs. Data are presented as mean ± SD of three experiments. **P<0.01, ***P<0.001, ****P<0.0001 (one-way ANOVA (and nonparametric) and t-tests), ns means not statistical significance. (B) Fluorescence microscopy images at 48 hrs.
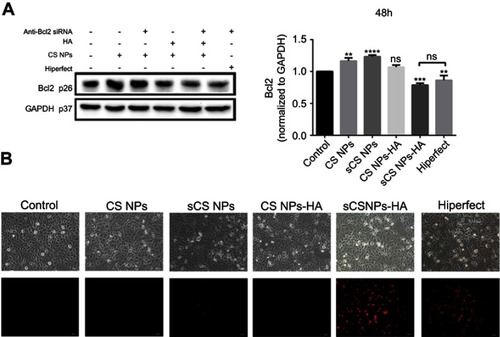
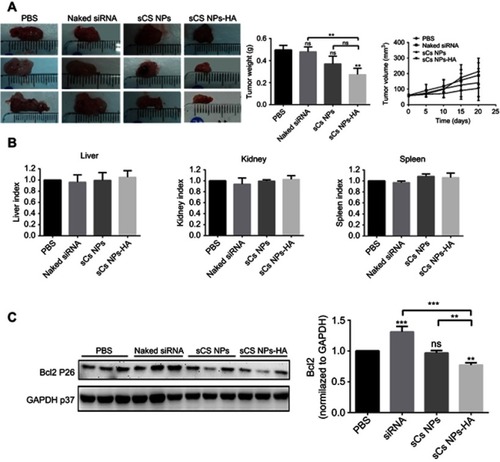
Figure 6 Effects of sCS NPs-HA on tumor growth, the injection dose of Cy3-labeled siRNA in all experimental groups was 0.16 mg siRNA/kg. (A) Tumors isolated from murine groups PBS, naked Cy3-labeled siRNA, sCS NPs, and sCS NPs-HA. The weight of tumors in the murine sCS NPs-HA group was significantly lower as compared with the PBS group. **P<0.01 (one-way ANOVA (and nonparametric) and t-tests), ns means not statistical significance. The tumor growth inhibition graph showed that the growth of subcutaneous tumor volume in the sCS NPs-RNA group was significantly inhibited. (B) The indices (weight ratios) of liver, kidneys, or spleen to the body weight for all groups (n≥3). There were no statistically significant differences between the control and any experimental groups, P>0.5 (one-way ANOVA (and nonparametric)). (C) Expression levels of the BCL2 protein in the tumors from mice, as determined by Western blotting and normalized to GAPDH expression. Data are presented as mean ± SD of three experiments. **P<0.01, ***P<0.001, ****P<0.0001 (one-way ANOVA (and nonparametric) and t-tests).