Figures & data
Figure 1 (A) Schematic representation of the synthesis of theranostic platform RCPD for combined chemo-photo treatment of cancer cells. (B) UV−Vis absorption and fluorescence spectra of RCPD. (C) Size distribution of RCPD. (D) Drug release profiles of DTX from DTX suspension, RCPD (pH=5.5 or 7.4), PAMAM@DTX.
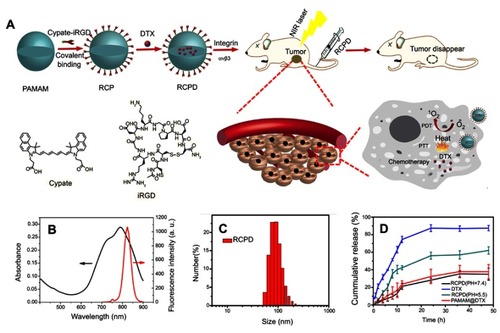
Figure 2 (A) Fluorescence intensity ratio of cypate and RCPD with PBS (0.16 mM cypate-equiv.) before (dark) and after (light) NIR irradiation (1.6 W/cm2, 5 mins). **p<0.01, ***p<0.001. (B) Singlet oxygen generation by RCPD (0.02–0.16 mM cypate-equiv.) after NIR irradiation (1.6 W/cm2, 5 mins). (C) Singlet oxygen generation by RCPD (0.16 mM cypate-equiv.) after NIR irradiation with different power density (0.3, 0.96, 1.6 W/cm2, 5 mins). (D) Temperature change curves of PBS, cypate, and RCPD aqueous solution (0.16 mM cypate-equiv.) exposed to laser at a power density of 1.6 W/cm2. (E) Temperature change curves of RCPD aqueous solution (0.02–0.16 mM cypate-equiv.) exposed to laser at a power density of 1.6 W/cm2. (F) Temperature change curves of RCPD aqueous solution (0.16 mM cypate-equiv.) exposed to laser at the following power densities: 0.3, 0.96 and 1.6 W/cm2.
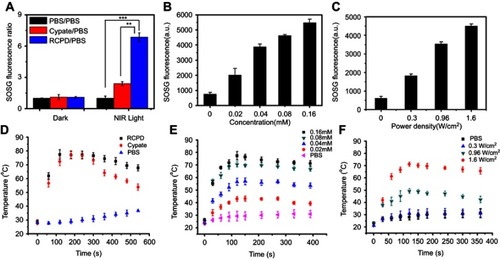
Figure 3 (A) Confocal images of HepG2 cells after 1 hr, 2 hrs, 4 hrs, and 12 hrs of incubation with RCPD. Scale bar is 40 μm. (B) The confocal microscopy analysis of cellular uptakes of RCPD at different time.
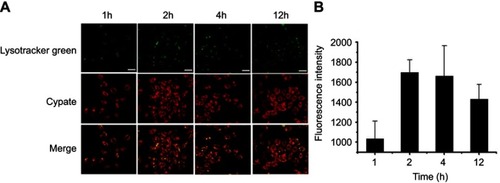
Figure 4 (A) Confocal images of ROS generation in HepG2 cells at 24 hrs after various treatments. Scale bar is 50 μm. (B) The flow cytometric analysis of intracellular ROS productions in HepG2 cells treated with RCPD or cypate after NIR irradiation (1.6 W/cm2, 5 mins). (C) Temperature viabilities of HepG2 cells treated with PBS, RCPD, or cypate.
Abbreviations: ROS, reactive oxygen species.
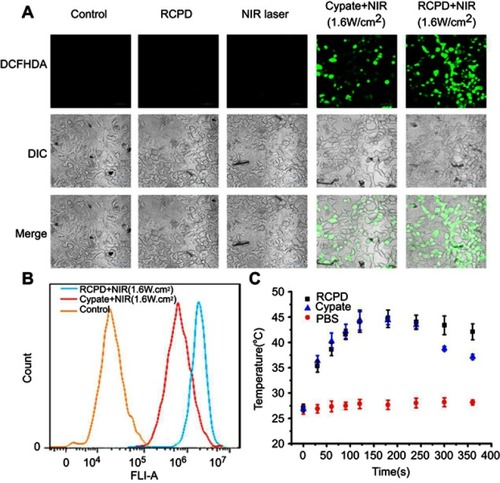
Figure 5 (A) The LIVE-DEAD analysis of HepG2 cells at 24 hrs after various treatments. Scale bar is 100 μm. (B) The cell viability of DTX-resistant human liver cancer cells at 24 hrs after various treatments (*p<0.05). (C) Stacked bars of HepG2 cells apoptosis determined by flow cytometry using Annexin V-FITC and PI. (D) The cell apoptosis quantified by the flow cytometry at 24 hrs after various treatments. The cypate and DTX concentrations were 32 μM and 18.6 μM, respectively. In all experiments, PDT was irradiated with 808 nm, 0.3 W/cm2, PDT+PTT was irradiated with 808 nm, 1.6 W/cm2.
Abbreviations: PTT, photothermal therapy; PDT, photodynamic therapy.
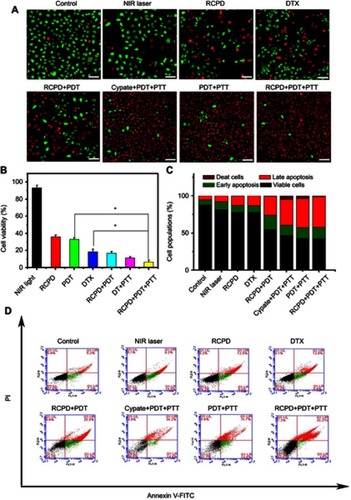
Figure 6 (A) The confocal images of SOSG-stained sections at 6 hrs after various treatments. Scale bars represent 100 μm. (B) Temperature change curves in tumors exposed to the 808 nm laser at a power density of 0.3 W/cm2 and 1.6 W/cm2 after intravenous injections of saline, RCP, and RCPD.
Abbreviations: SOSG, singlet oxygen sensor green.
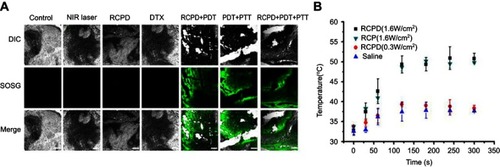
Figure 7 (A) The tumor growth curves of mice after various treatments. (B) The body weight changes of mice during various treatments. (C) The photos of mice and excised tumors after various treatments. The red circles indicate the tumor size. (D) The images of H&E stained tumor sections after various treatments. Scale bars represent 50 μm. The doses of cypate and DTX in all the above experiments were 6.7 and 5 mg/kg. The laser irradiation was carried out on the tumor at 808 nm at a power density of 0.3 W/cm2 or 1.6 W/cm2 for 5 mins. -*p<0.05, **p<0.01, ***p<0.001 for comparison to the control-.
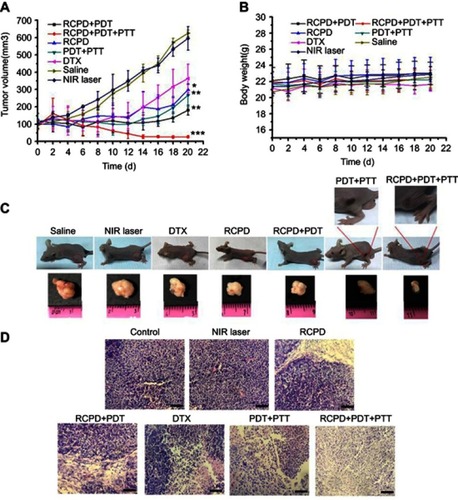
Figure S1 (A) Size distribution of RCP (B) Zeta potential of RCPD, RCP and PAMAM
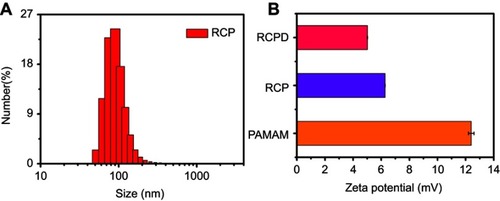
Figure S2 TEM image of RCPD. Scale bar is 100nm
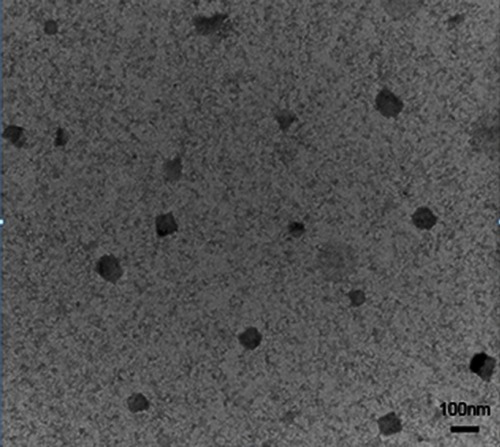
Figure S3 Singlet oxygen generation at different time by RCPD (0.16 mM cypate-equiv) after NIR irradiation (808 nm laser diode, 1.6 W/cm2)
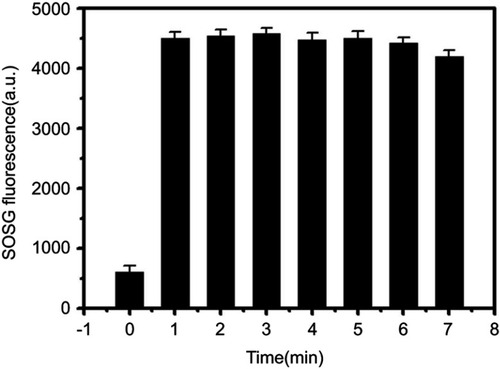
Figure S4 Cytotoxicity on HepG2 cells incubated with different concentrations of RCP or RCPD at (A) 24 h, (B) 48 h. Cytotoxicity on Paclitaxel resistant HepG2 cells incubated with different concentrations of RCP or RCPD at (C) 24h, (D) 48h. The doses of DTX in all above experiments was 2.3-37.2 µM
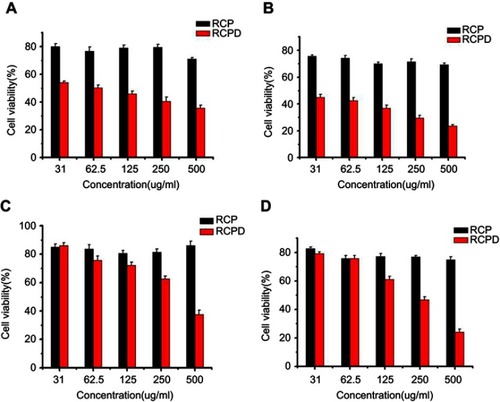
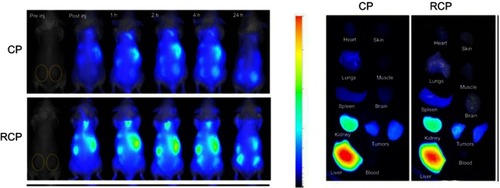
Figure S5 NIR images of HepG2 tumor xenograft bearing nude mice after intravenous injection CP or RCP and main organs excised from the tumor mice 24 h after intravenous injection of CP or RCP