Figures & data
Table 1 The mean number of moieties attached to each PEI
Figure 1 Preparation of BmK CT-Au PENPs-131I.
Abbreviations: PEI, polyethylenimine; Au NPs, gold nanoparticles; mPEG-COOH, carboxyl-terminated methoxy PEG; EDC, 1-ethyl-3-(3-dimethylaminopropyl) carbodiimide hydrochloride; MAL-PEG-SVA, maleimide-PEG-succinimidyl valerate; BmK CT, Buthus martensii Karsch chlorotoxin; FI, fluorescein isothiocyanate; HPAO, 3-(4′-hydroxyphenyl)propionic acid-OSu; ch-T, chloramine-T trihydrate; BmKCT-Au PENPs-131I, 131I-labeled BmK CT modified polyethylenimine-entrapped gold nanoparticles; NaBH4, sodium borohydride.
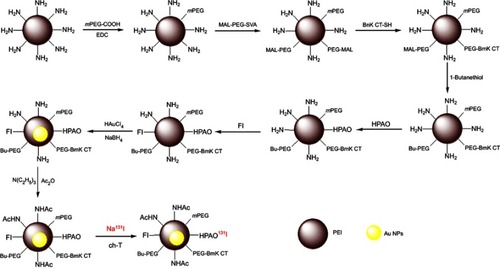
Figure 2 TEM image and size distribution of BmK CT-Au PENPs. (A) TEM image, (B) size distribution, (C) high-resolution TEM image, (D) selected area electron diffraction pattern, and (E) EDS spectrum of BmK CT-Au PENPs.
Abbreviations: TEM, transmission electron microscopy; BmK CT, Buthus martensii Karsch chlorotoxin; BmK CT-Au PENPs, BmK CT modified polyethylenimine-entrapped gold nanoparticles; EDS, energy dispersive spectroscopy.
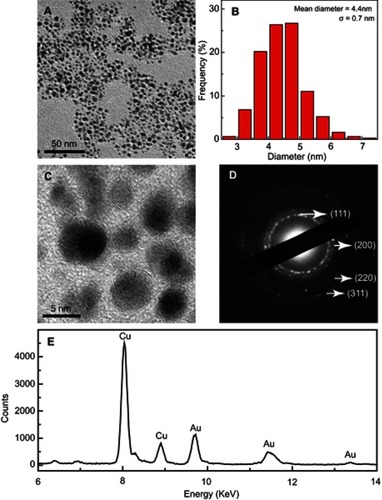
Figure 3 CT imaging of BmK CT-Au PENPs and SPECT imaging of BmK CT-Au PENPs-131I in vitro. CT images of (A) BmK CT-Au PENPs and (B) Omnipaque at different Au or I concentrations, and (C) X-ray attenuation intensities. CT images of C6 cells treated with (D) Au PENPs or (E) BmK CT-Au PENPs for 4 hours at different Au concentrations, and (F) quantitative HU values. SPECT images of C6 cells treated with (G) Au PENPs-131I or (H) BmK CT-Au PENPs-131I for 4 hours at different radioactive concentrations, and (I) relative SPECT signal intensities. ** p<0.01, ***p<0.001
Abbreviations: CT, computed tomography; SPECT, single-photon emission computed tomography; BmK CT, Buthus martensii Karsch chlorotoxin; BmK CT-Au PENPs, BmK CT modified polyethylenimine-entrapped gold nanoparticles; Au PENPs, polyethylenimine-entrapped gold nanoparticles; BmK CT-Au PENPs-131I, 131I-labeled BmK CT modified polyethylenimine-entrapped gold nanoparticles; Au PENPs-131I, 131I-labeled polyethylenimine-entrapped gold nanoparticles.
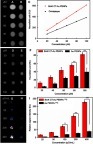
Figure 4 SPECT imaging of BmK CT-Au PENPs-131I and Au PENPs-131I in vivo. SPECT images of C6 tumor-bearing nude mice treated with (A) BmK CT-Au PENPs-131I and (B) Au PENPs-131I at different time points, and (C) SPECT images of ex vivo tumors at 8 hours post-injection. (D) The tumor relative signal intensities at different time points. The white circle denotes the tumor site. ***p<0.001
Abbreviations: SPECT, single-photon emission computed tomography; BmK CT, Buthus martensii Karsch chlorotoxin; BmK CT-Au PENPs-131I, 131I-labeled BmK CT modified polyethylenimine-entrapped gold nanoparticles; Au PENPs-131I, 131I-labeled polyethylenimine-entrapped gold nanoparticles.
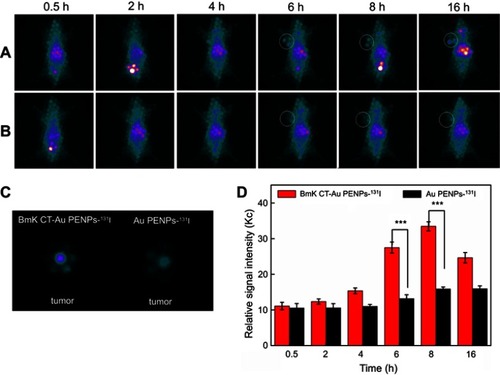
Figure 5 CT imaging of BmK CT-Au PENPs and Au PENPs in vivo. CT images of the C6 tumor-bearing nude mice before and after treatment with (A) BmK CT-Au PENPs and (B) Au PENPs, and (C) tumor CT values at different time points. The white circle denotes the tumor site. ***p<0.001
Abbreviations: CT, computed tomography; BmK CT, Buthus martensii Karsch chlorotoxin; BmK CT-Au PENPs, BmK CT modified polyethylenimine-entrapped gold nanoparticles; Au PENPs, polyethylenimine-entrapped gold nanoparticles.
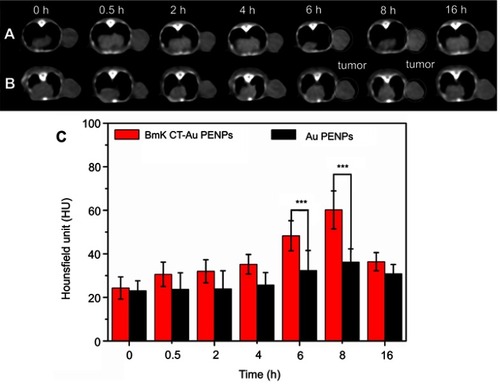
Figure 6 Tumor inhibition by BmK CT-Au PENPs-131I in vivo. (A) Relative tumor volume of C6 tumor-bearing nude mice treated with saline, Au PENPs, BmK CT-Au PENPs, Au PENPs-131I, and BmK CT-Au PENPs-131I. (B) Survival rate, (C) H&E staining, and (D) TUNEL assay of C6 tumor-bearing mice after a 21-day treatment course (mean ± SD, n=5). The scale bar shown in both panels represents 200 μm.
Abbreviations: BmK CT, Buthus martensii Karsch chlorotoxin; BmK CT-Au PENPs, BmK CT modified polyethylenimine-entrapped gold nanoparticles; Au PENPs, polyethylenimine-entrapped gold nanoparticles; BmK CT-Au PENPs-131I, 131I-labeled BmK CT modified polyethylenimine-entrapped gold nanoparticles; Au PENPs-131I, 131I-labeled polyethylenimine-entrapped gold nanoparticles.
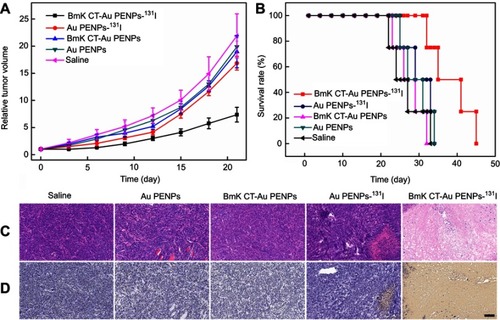
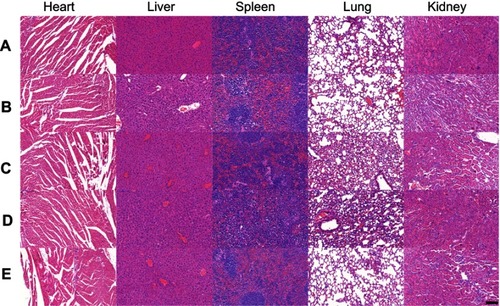
Figure 7 H&E staining of the heart, liver, spleen, lung, and kidney of the mice after the 21-day treatment of (A) saline, (B) Au PENPs, (C) BmK CT-Au PENPs, (D) Au PENPs-131I, and (E) BmK CT-Au PENPs-131I. The scale bar in each panel indicates 200 μm.
Abbreviations: BmK CT, Buthus martensii Karsch chlorotoxin; BmK CT-Au PENPs, BmK CT modified polyethylenimine-entrapped gold nanoparticles; Au PENPs, polyethylenimine-entrapped gold nanoparticles; BmK CT-Au PENPs-131I, 131I-labeled BmK CT modified polyethylenimine-entrapped gold nanoparticles; Au PENPs-131I, 131I-labeled polyethylenimine-entrapped gold nanoparticles.