Figures & data
Figure 1 Synthesis scheme used to produce the nanoliposomes used in this study. Reagents were dissolved in ethanol, diluted with PBS, and incubated with RNA. After vigorous stirring, resultant liposomes undergo dialysis for 1 day. Samples are stored at 4°C (with or without sonication). (A and B) demonstrate the multi-model size population nature of synthesized liposomes. Scale bar represents 200 nm in both images.
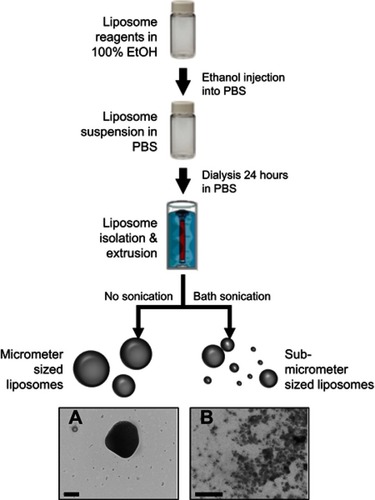
Figure 2 Microscopy images of microliposomes and nanoliposomes. (A and B) Light micrographs of microliposomes show particles in a bimodal size distribution. (C) Scanning electron micrograph and (D) transmission electron micrograph of nanoliposomes in a monodisperse size population.
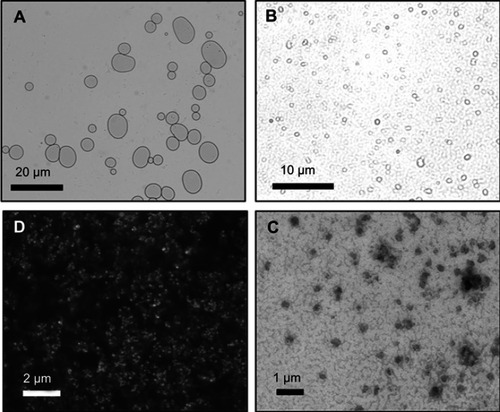
Table 1 List of controllable parameters used to tune the size of resultant liposomes
Table 2 Effects on miRNA-loaded liposome population size over time when changing temperature
Figure 3 Effects on liposome population size when changing concentration and ionic strength of suspension media. (A) Particle size distribution of microliposomes. (B) Particle size distribution of nanoliposomes. Samples were diluted 100X, resulting in 1 mg/mL concentrations. For both micro- and nanoliposome samples, size decreases when concentration decreases.
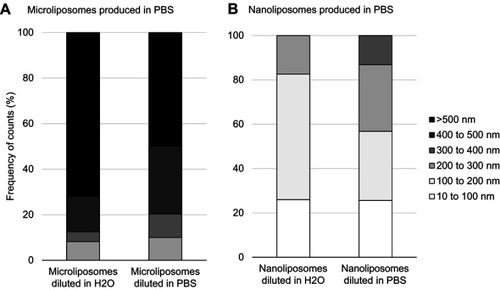
Figure 4 Scanning electron micrographs of (A and B) microliposomes and (C and D) nanoliposomes after lyophilization and stored for 168 hrs.
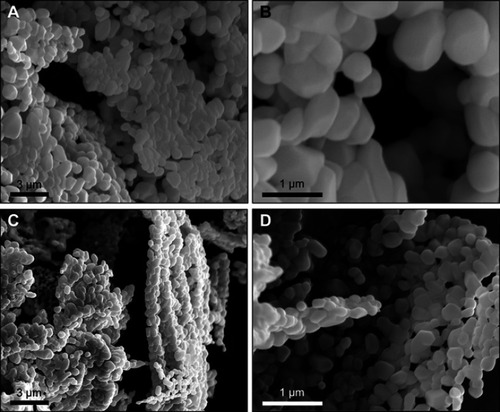
Table 3 RNA encapsulation efficacy in liposomes at time of production versus after resuspending stored liposomes
Figure 5 Effect on liposome population size after incubation in ultrapure water (UPH2O), PBS solution, and 10% FBS over time. The size (A) and the zeta potential (B) of the microliposomes both decrease significantly over time when in UPH2O, while the size and zeta potential of the microliposomes remain relatively constant in PBS or 10% FBS over time. However, the size (C) and zeta potential (D) of the nanoliposomes suspended in UPH2O, PBS, and FBS remain constant over time.
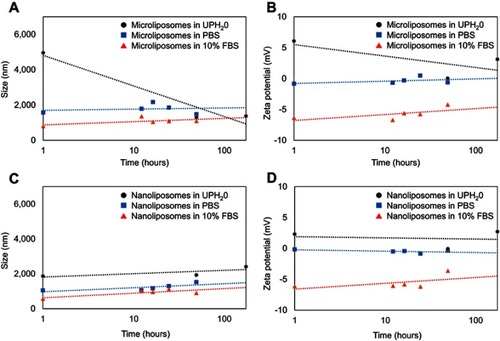
Figure 6 Liposomes are internalized and deliver detectable levels of microRNA in the breast cancer cell lines. (A) Quantitative RT-PCR was performed on the indicated cell lines 4 hrs after addition of miR-203 loaded liposomes at a concentration of 500 nM. MCF7 cells, expressing abundant miR-203, are used as a reference cell line. Small nucleolar RNA U6 was used as a normalization control. (B) Fluorescence confocal microscopy was performed on MDA-MB-231 cells 4 hrs after exposure to the indicated liposomes or transfection reagent, mixed with FITC-labeled siRNA. Counterstaining with DAPI and LysoTracker Red was then performed. Scale bar represents 15 µm for major panels and 5 µm for insets. Arrows indicate regions with distributed extra-endosomal FITC-siRNA. Arrowhead indicates region expanded for inset.
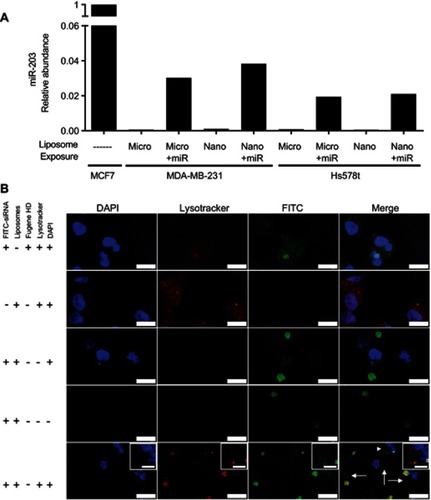
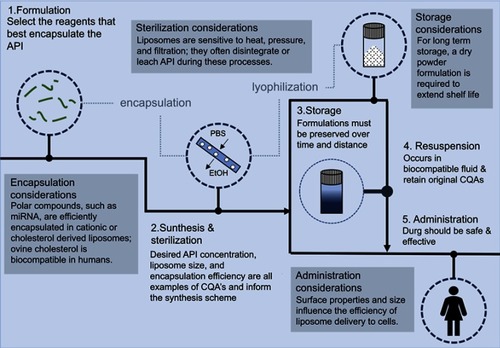
Figure 7 The liposomal drug product development pipeline highlights the main steps of synthesis, formulation, sterilization, storage, resuspension, and administration. Additional considerations are also included to provide more details along the flowchart.