
Figures & data
Figure 1 Cell viability 48 hours after transfection.
Notes: *P<0.05, **P<0.01 and ***P<0.001 vs the blank group. The error bars represent the mean±SD (n=3).
Abbreviations: LNPs, lipopolysaccharide-amine nanopolymersomes; lipo, lipofectamine3000.
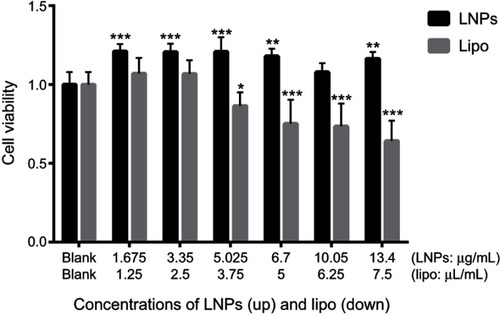
Figure 2 (A and B) Images of MC3T3-E1 cells treated by different concentrations of LNPs/siRNA or lipo/siRNA 24 hours after transfection treatment. (C) Efficiency of cell uptake quantified by flow cytometry 48 hours after transfection.
Abbreviations: LNPs, lipopolysaccharide-amine nanopolymersomes; lipo, lipofectamine3000.
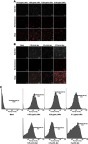
Figure 3 Expression of Noggin and Noggin protein in MC3T3-E1 cells transfected with different siRNA delivery systems. (A) Expression of Noggin on day-2 (PCR data). (B) Expression of Noggin protein on day-3 (data from Western blotting). (C) Semiquantitation of Noggin protein from Western blotting images analyzed by ImageJ software.
Notes: *P<0.05 and ***P<0.001 vs the blank group. ###P<0.001. The error bars represent the mean±SD (n=3).
Abbreviations: LNPs, lipopolysaccharide-amine nanopolymersomes; lipo, lipofectamine3000.
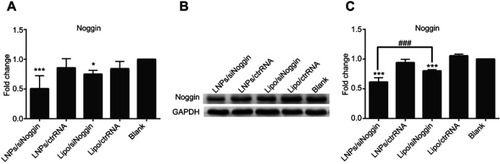
Figure 4 Effects of transfection via different systems on proliferation of MC3T3-E1 cells on days 1, 3, 5, and 7. The error bars represent the mean±SD (n=3).
Notes: *P<0.05 and **P<0.01 vs the blank group. #P<0.05, ##P<0.01 and ###P<0.001. The error bars represent the mean±SD (n=3).
Abbreviations: LNPs, lipopolysaccharide-amine nanopolymersomes; lipo, lipofectamine3000.
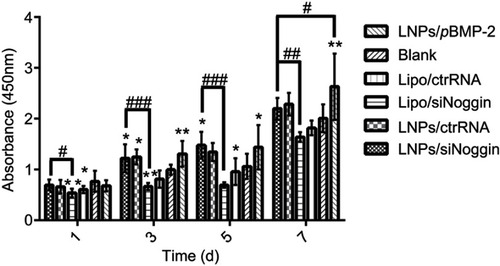
Figure 5 ALP activity (A) and relative expression of Runx2 mRNA determined by RT-PCR (B) in transfected MC3T3-E1 cells after 7 days and 14 days of culture in osteogenic medium.
Notes: *P<0.05, **P<0.01 and ***P<0.001 vs the blank group. ##P<0.01 and ###P<0.001. The error bars represent the mean±SD (n=3).
Abbreviations: LNPs, lipopolysaccharide-amine nanopolymersomes; lipo, lipofectamine3000; ALP, alkaline phosphatase.
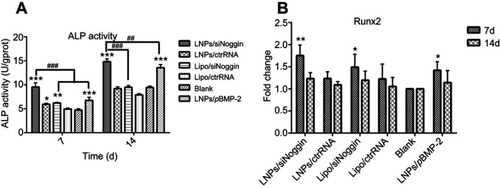
Figure 6 Mineralization of transfected MC3T3-E1 cells on day 28. (A) Alizarin Red staining. Photos (upper) and microscopic images (lower) show formation of calcified nodules (stained red). (B) Quantification of calcified nodules dissolved by 10% cetylpyridinium chloride solution.
Notes: ***P<0.001 vs the blank group. The error bars represent the mean±SD (n=3).
Abbreviations: LNPs, lipopolysaccharide-amine nanopolymersomes; lipo, lipofectamine3000.
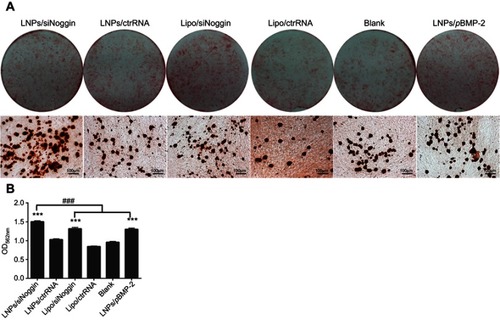
Figure 7 Effects of siNoggin and pBMP-2 treatment on expression of osteogenic-related proteins on day 3 (A, B) and 7 (C, D). (A, C) Representative Western blots of each protein. (B, D) Semiquantitative expression of BMP-2, OPN, β-catenin, and Runx2 proteins by ImageJ software.
Notes: *P<0.05, **P<0.01 and ***P<0.001 vs the blank group. #P<0.05, ##P<0.01 and ###P<0.001. The error bars represent the mean±SD (n=3).
Abbreviations: LNPs, lipopolysaccharide-amine nanopolymersomes; lipo, lipofectamine3000.
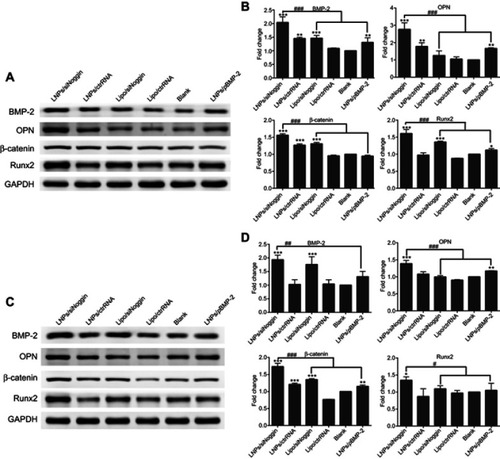
Figure 8 Effects of siNoggin and pBMP-2 treatment on expression of osteogenic-related proteins on days 14 (A, B) and 21 (C, D). (A, C) Representative Western blots of each protein. (B, D) Semiquantitative expression of β-catenin protein and Runx2 protein by ImageJ software. The error bars represent the mean±SD (n=3).
Notes: *P<0.05, **P<0.01 and ***P<0.001 vs the blank group. #P<0.05, ##P<0.01 and ###P<0.001. The error bars represent the mean±SD (n=3).
Abbreviations: LNPs, lipopolysaccharide-amine nanopolymersomes; lipo, lipofectamine3000.
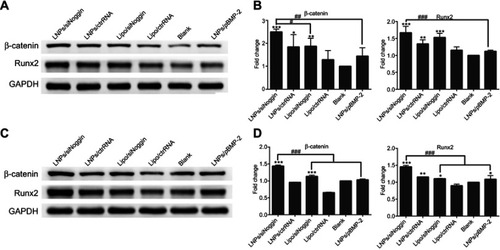
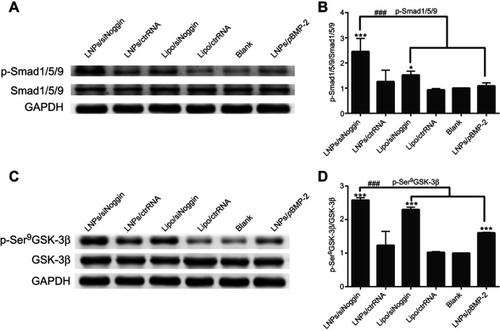
Figure 9 LNPs/siNoggin promotes osteogenesis differentiation by activating BMP/Smad and GSK-3β/β-catenin signaling pathways in MC3T3-E1 cells on day-3. (A) Effects on the expression of phosphor-Smad/1/5/9 proteins. (C) Effects on the expression of phosphor-GSK-3β (Ser9) protein. (B, D) Semiquantitative expression of phosphor-Smad/1/5/9 or phosphor-GSK-3β (Ser9) proteins by ImageJ software.
Notes: *P<0.05, **P<0.01 and ***P<0.001 vs the blank group. The error bars represent the mean±SD (n=3).
Abbreviations: LNPs, lipopolysaccharide-amine nanopolymersomes; lipo, lipofectamine3000.
Scheme 1 Possible signaling pathways and roles of LNPs/siNoggin and LNPs/pBMP-2 for osteogenesis.
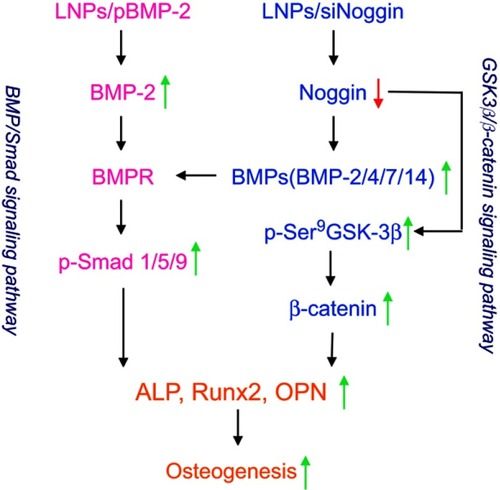
Table S1 Primer sequences