Figures & data
Table 1 Characterization of the AuNPs-PAA and AuNPs-PAA-Ctxb dispersed in different media.
Table 2 Overview of the performed cell assays, exposure conditions and results
Figure 1 EGFR expression in HK-2 cells, THLE-2 cells, TIME cells and MDA-MB-453 cells relative to EGFR expression in A431 cells, determined by Western blot. Results are expressed as mean ± SE and are obtained from at least 4 independent replicates. Protein bands were normalized against β-actin.
Abbreviations: A431, human epidermoid cancer cells; EGFR, epidermal growth factor receptor; HK-2, human kidney cells; MDA-MB-453, human breast cancer cells; SE, standard error; THLE-2, human liver cells; TIME, human telomerase immortalized microvascular endothelial cells.
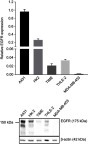
Figure 2 Transmission electron microscopy images demonstrating the internalization of AuNPs-PAA-Ctxb in A431 cells (A and B), MDA-MB-453 cells (C and D), HK-2 cells (E and F), THLE-2 cells (G and H) and TIME cells (I and J). The cells were exposed to 5.0 µg Au/mL of AuNPs-PAA-Ctxb for 3 h (left column) or 24 h (right column). Arrows indicate AuNPs-PAA-Ctxb. Images were acquired at different magnifications. Size bar =1 µm, N = Nucleus.
Abbreviations: AuNPs-PAA-Ctxb, polyallylamine-coated gold nanoparticles conjugated to Cetuximab; A431, human epidermoid cancer cells; HK-2, human kidney cells; MDA-MB-453, human breast cancer cells, THLE-2, human liver cells; TIME, human telomerase immortalized microvascular endothelial cells.
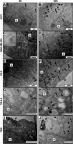
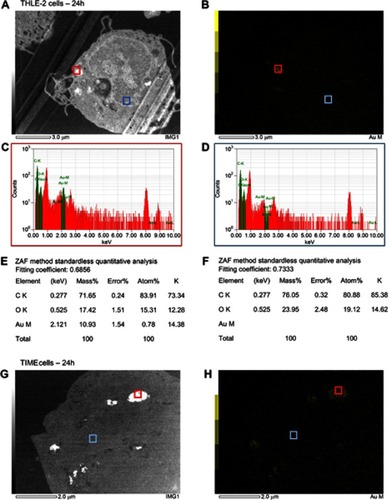
Figure S2 Energy dispersive X-ray spectroscopy analysis on a representative THLE-2 cell (A), a TIME cell (G) and a HK-2 cell (M, N), which were treated with 5 µg Au/mL of AuNPs-PAA-Ctxb for 3 h or 24 h. Gold mapping was performed on the THLE-2 cell (B) and the TIME cell (H). Bright signal zones (red squares) were analyzed resulting in specific X-ray spectra (C, I, O) and quantification of gold, carbon and oxygen (E, K, Q). No-signal zones (blue squares) were analyzed resulting in specific X-ray spectra (D, J, P) and the detection of only carbon and oxygen (F, L, R).
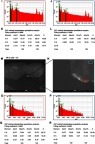
Figure 3 Interaction of AuNPs-PAA(±Ctxb) with A431 cells (A), MDA-MB-453 cells (B), HK-2 cells (C), THLE-2 cells (D) and TIME cells (E) quantified with ICP-MS. The cells were exposed to 5.0 µg Au/mL of AuNPs-PAA(±Ctxb) for 3 h, 6 h, 12 h or 24 h. Results are expressed as mean pg gold per cell ± SD calculated from 3 replicates per condition obtained from one experiment. A significant difference compared to 3 h of exposure was calculated by a Kruskal-Wallis test and a Dunn’s post-hoc test (*p<0.05).
Abbreviations: A431, human epidermoid cancer cells; Ctxb, Cetuximab; Au, gold; AuNPs-PAA, polyallylamine-coated gold nanoparticles; HK-2, human kidney cells; ICP-MS, inductively coupled plasma mass spectrometry; MDA-MB-453, human breast cancer cells; SD, standard deviation; THLE-2, human liver cells; TIME, human telomerase immortalized microvascular endothelial cells.
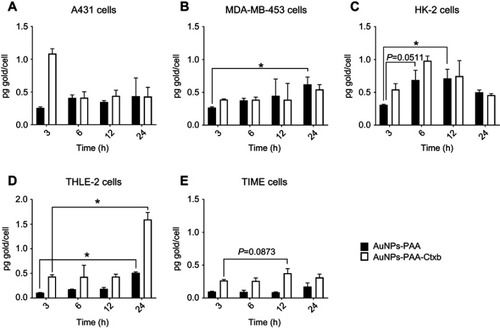
Table 3 EC50 values after 24 h of cell exposure and LOEC after 3 h and 24 h of exposure to AuNPs-PAA and AuNPs-PAA-Ctxb.
Figure 4 Cell viability after exposure to AuNPs-PAA (black curves) and AuNPs-PAA-Ctxb (gray curves) of A431 cells (A and B), MDA-MB-453 cells (C and D), HK-2 cells (E and F), THLE-2 cells (G and H) and TIME cells (I and J). Cells were exposed to increasing concentrations of AuNPs-PAA or AuNPs-PAA-Ctxb for 3 h or 24 h. The number of viable cells was assessed by MTS assay. The results are expressed as the mean percentage of viable cells relative to the unexposed cells ± SE and are obtained from at least three independent experiments with a minimum of three replicates per condition. A significantly reduced viability compared to the unexposed control was calculated by a one-way ANOVA and a Dunnett post-hoc test (*p<0.05, **p<0.01, ***p<0.001 ****p<0.0001).
Abbreviations: A431, human epidermoid cancer cells; ANOVA, analysis of variance; AuNPs-PAA, polyallylamine-coated gold nanoparticles; Ctxb, Cetuximab; HK-2, human kidney cells; MDA-MB-453, human breast cancer cells; MTS, 3-(4,5-dimethylthiazol-2-yl)-5-(3-carboxymethoxyphenyl)-2-(4-sulfophenyl)-2H-tetrazolium); SE, standard error; THLE-2, human liver cells; TIME, human telomerase immortalized microvascular endothelial cells.
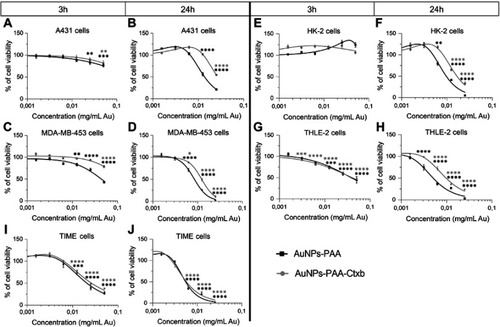
Figure 5 Live cell imaging for caspase 3/7 activation (left lanes) and annexin V labeling (right lanes) in A431 cells (A and B, K and L), MDA-MB-453 cells (C and D, M and N), HK-2 cells (E and F, O and P), THLE-2 cells (G and H, Q and R) and TIME cells (I and J, S and T). The cell lines were exposed to increasing concentrations of AuNPs-PAA or AuNPs-PAA-Ctxb. Time-lapse pictures were taken every 2 h for 72 h. The results are expressed as the mean area of caspase 3/7 or annexin V per well ± SE and are obtained from at least three replicates. A significant increase in caspase 3/7 activity and annexin V labeling compared to unexposed control cells was calculated by a two-way ANOVA and a Dunnett post-hoc test. The start of significance is visualized by vertical bars (*p<0.05, **p<0.01, ***p<0.001 ****p<0.0001).
Abbreviations: A431, human epidermoid cancer cells; ANOVA, analysis of variance; AuNPs-PAA, polyallylamine-coated gold nanoparticles; Ctxb, Cetuximab; HK-2, human kidney cells; MDA-MB-453, human breast cancer cells; SE, standard error; THLE-2, human liver cells; TIME, human telomerase immortalized microvascular endothelial cells.
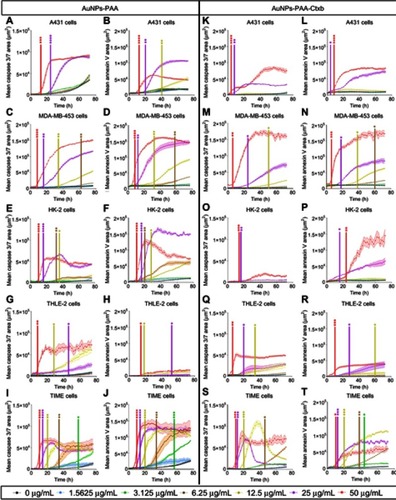
Figure 6 Mitochondrial membrane potential measurements of the HK-2 cells (A), THLE-2 cells (B) and TIME cells (C) after exposure to AuNPs-PAA or AuNPs-PAA-Ctxb. TIME cells were exposed to 3.0 µg Au/mL, THLE-2 and HK-2 cells were exposed to 5.0 µg Au/mL of AuNPs-PAA or AuNPs-PAA-Ctxb. During the 12 h exposure, 2 nM NAC was added to assess oxidative stress. The mitochondrial membrane potential was measured with TMRM fluorescence, detected by flow cytometry. The results are expressed as mean TMRM fluorescent signal relative to the unexposed control cells (red line) ± SE and are obtained from at least three independent experiments with a minimum of three replicates per condition. Significant difference in TMRM signal compared to the unexposed control was calculated by a one-way ANOVA and a Dunnett post-hoc test (bullets). Significant difference in TMRM fluorescent signal between AuNPs-PAA and AuNPs-PAA-Ctxb exposed cells, or between nanoparticle-exposed cells and NAC co-exposed cells, was calculated by a Student’s t-test (asterisks) (*p<0.05, **p<0.01, ***p<0.001 ****p<0.0001).
Abbreviations: ANOVA, analysis of variance; AuNPs-PAA, polyallylamine-coated gold nanoparticles; Ctxb, Cetuximab; HK-2, human kidney cells; NAC, N-acetyl L-cysteine; SE, standard error; THLE-2, human liver cells; TIME, human telomerase immortalized microvascular endothelial cells; TMRM, tetramethylrhodamine methyl ester.
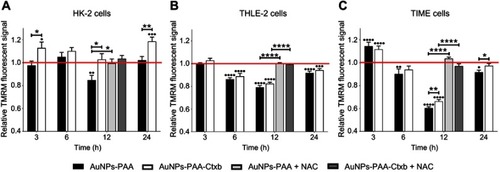
Figure 7 Thioredoxin reductase and glutathione reductase activity in the HK-2 cells (A), THLE-2 cells (B) and TIME cells (C) after exposure to AuNPs-PAA or AuNPs-PAA-Ctxb. TIME cells were exposed to 3.0 µg Au/mL, THLE-2 and HK-2 cells were exposed to 5.0 µg Au/mL of AuNPs-PAA or AuNPs-PAA-Ctxb for 12 h. The enzyme activity rate per minute was measured by the increase in absorbance at 405 nm for GR and at 412 nm for TrxR. The results are expressed as mean enzyme activity rate per minute per 100 µg of protein ± SE and are obtained from at least three independent experiments with a minimum of two replicates per condition. Significant difference in enzyme activity rate compared to the unexposed control was calculated by a Student’s t-test (*p<0.05, **p<0.01, ***p<0.001 ****p<0.0001).
Abbreviations: AuNPs-PAA, polyallylamine-coated gold nanoparticles; Ctxb, Cetuximab; GR, Glutathione reductase; HK-2, human kidney cells; SE, standard error; THLE-2, human liver cells; TIME, human telomerase immortalized microvascular endothelial cells; TrxR, Thioredoxin reductase.
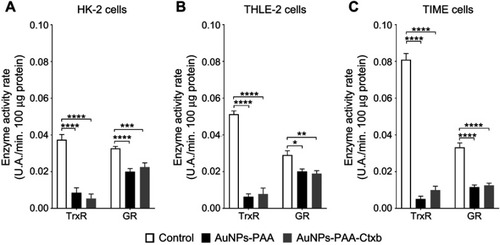
Figure 8 Live cell imaging for caspase 3/7 activation (left panels) and annexin V labeling (right panels) in A431 cells (A and B, K and L), MDA-MB-453 cells (C and D, M and N), HK-2 cells (E and F, O and P), THLE-2 cells (G and H, Q and R) and TIME cells (I and J, S and T). The cell lines were co-exposed to increasing concentrations of AuNPs-PAA or AuNPs-PAA-Ctxb and 2 nM of NAC. Time-lapse pictures were taken every 2 h for 72 h. The results are expressed as the mean area of caspase 3/7 or annexin V per well ± SE and are obtained from at least three replicates. A significant increase in caspase 3/7 activity and annexin V labeling compared to unexposed control cells was calculated by a two-way ANOVA and a Dunnett post-hoc test. The start of significance is visualized by vertical bars (*p<0.05, **p<0.01, ***p<0.001 ****p<0.0001).
Abbreviations: A431, human epidermoid cancer cells; ANOVA, analysis of variance; AuNPs-PAA, polyallylamine-coated gold nanoparticles; Ctxb, Cetuximab; HK-2, human kidney cells; MDA-MB-453, human breast cancer cells; SE, standard error; NAC, N-acetyl L-cysteine; THLE-2, human liver cells; TIME, human telomerase immortalized microvascular endothelial cells.
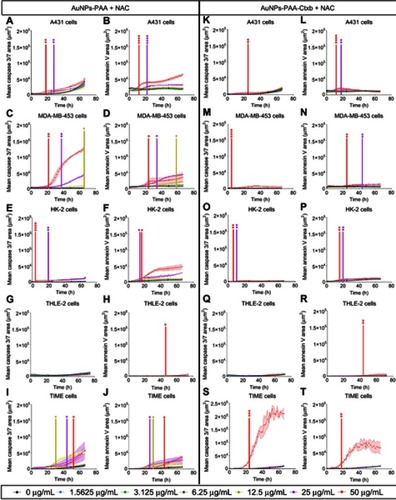
Figure 9 Correlation analyses showing the relation between the residual mitochondrial membrane potential and cell viability (A); the basal TrxR activity and cell viability (B); the extent of TrxR activity and cell viability (C); and the extent of TrxR inhibition and the residual mitochondrial potential (D). Data are presented as mean ± SD (for mitochondrial membrane potential and TrxR activity) or 95% CI (for EC50). 1= HK-2 cells, 2= THLE-2 cells and 3= TIME cells.
Abbreviations: CI, confidence interval; HK-2, human kidney cells; SD, standard deviation; THLE-2, human liver cells; TIME, human telomerase immortalized microvascular endothelial cells; TrxR, thioredoxin reductase; AuNPs-PAA, polyallylamine-coated gold nanoparticles; Ctxb, cetuximab; EC50, half maximal effect concentration.
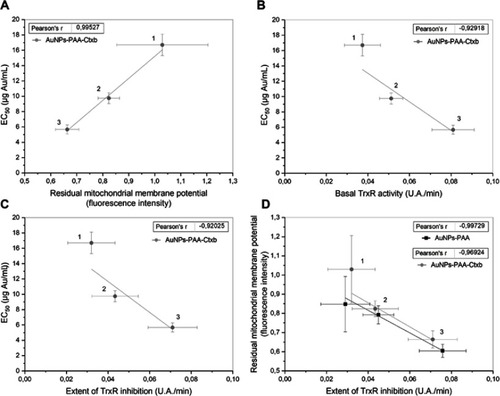
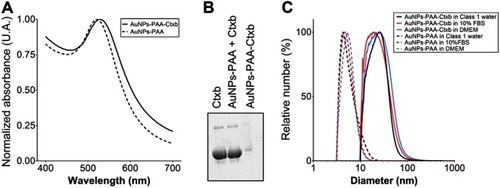
Figure S1 UV-Vis spectrum of AuNPs-PAA and AuNPs-PAA-Ctxb (A). Gel electrophoresis of Ctxb, AuNPs-PAA + Ctxb and AuNPs-PAA-Ctxb (B). Size distribution curves (relative number) of AuNPs-PAA and AuNPs-PAA-Ctxb in Class 1 water, DMEM and DMEM +10% FBS obtained from CPS Disk Centrifugation (Benelux Scientific, Eke, Belgium) (C).
Abbreviations: AuNPs-PAA, polyallylamine-coated gold nanoparticles; Ctxb, Cetuximab; FBS, Fetal bovine serum; DMEM, Dulbecco’s Modified Eagle Medium.