Figures & data
Figure 1 Cytotoxicity of OCNs on macrophages and the loading capacity of OCNs. (A) BMDMs were incubated with various concentrations of OCNs (0.8, 1.5, 3, 6.3, 12.5, 25, 50, and 100 µg/mL) for 24 hrs at 37°C. Cell viability was determined by the MTT assay. The results represent the mean ± SEM of the results from three independent experiments. (B) BMDMs were incubated with the mixtures of OCN+OVA at 3:1 and 1:1 (w/w) with or without indicated adjuvant for 24 hrs at 37°C. Cell viability was determined by MTT. The result represented the mean ± SEM from four independent experiments. (C, D) Three weight ratios of OCN+OVA (1:1, 2:1, and 3:1) were determined for the OVA-loading capacity (C) and OVA adsorption efficiency (D). Data represented the means ± SD from three independent experiments. The significance of differences between the groups was determined by one-way analysis of variance (ANOVA). ***p<0.001.
Abbreviations: OCN, oxidized carbon nanosphere; Poly(I:C), polyinosinic polycytidylic acid; MPL, monophosphoryl lipid A; HEPES, (4-(2-hydroxyethyl)-1-piperazineethanesulfonic acid; OVA, ovalbumin; MTT, thiazolyl blue tetrazolium bromide; PMA, phorbol myristate acetate; mβcd, methyl-ß-cyclodextrin; DMSO, dimethyl sulfoxide; w/w, weight-by-weight; EEA1, early endosomal antigen 1; LAMP1, lysosomal-associated membrane protein 1; LC3, microtubule-associated protein 1 light chain 3.
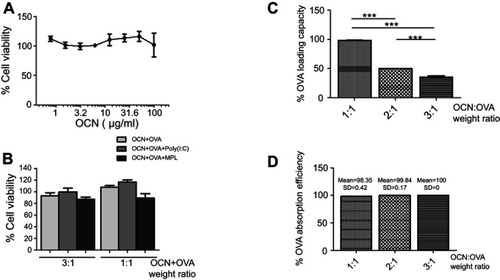
Figure 2 The kinetics of OVA uptake by BMDMs and the effect of temperature on the internalization of OVA delivered by OCNs. (A–B) BMDMs were incubated with OCN+OVA or OVA alone for the indicated durations. Cells were stained for detecting OVA or nuclei staining by Hoechst. (C–D) J774A.1, a macrophage cell line, was treated with OCNs, OVA, and OCN+OVA (1:1 w/w ratio) for 1 hr at 37°C or 4°C. The percentage of relative cellular OVA uptake (C) and the relative median fluorescent intensities (MFI) (D) were calculated relative to that of OCN+OVA at 37°C. Data were analyzed using one-way ANOVA followed by Tukey’s multiple comparison post hoc test, which represents the mean ± SEM from four independent experiments. ***p<0.001.
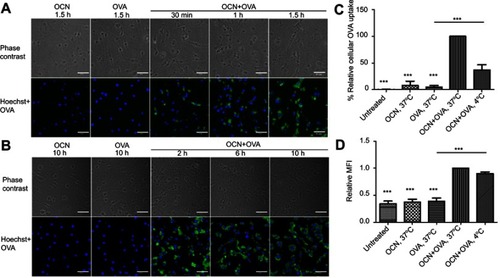
Figure 3 The effect of inhibitors on the internalization of OVA delivered by OCNs. J774A.1 cell line was pretreated with various concentrations of cytochalasin D or mβcd for 30 mins before the addition of OCN+OVA (1:1). Cells were further incubated for another 1 hr. The percentage of relative cellular OVA uptake and the relative MFI were calculated relative to OCN+OVA without inhibitor. (A, B) The results obtained from cells treated with cytochalasin D. (C, D) The results obtained from cells treated with mβcd. The results represent the mean ± SEM from three experiments. The data were analyzed by one-way ANOVA followed by Tukey’s multiple comparison post hoc test. *p<0.05, **p<0.01, and ***p<0.001.
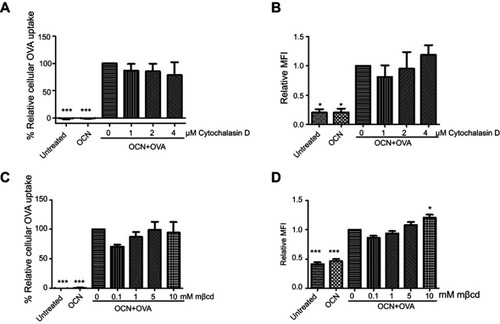
Figure 4 OVA delivered by OCNs did not colocalize with the endosomal compartment. OCN+OVA-fluorescein conjugate (ratio 3:1, green) were incubated with BMDMs. After 30 and 60 mins of incubation at 37°C, cells were subjected to immunofluorescence staining using rabbit monoclonal anti-EEA1 antibody and anti-rabbit IgG (H+L), F(ab’)2 fragment conjugated with Alexa Fluor® 555 for endosomes (red). Nuclei were stained with Hoechst (blue). Images were acquired by confocal microscopy. (A, E, I, M) Untreated cells, (B, F, J, N) cells incubated with OVA-fluorescein conjugate for 1 hr, (C, G, K, O) cells incubated with OCN+OVA-fluorescein conjugate for 30 mins, and (D, H, L, P) cells incubated with OCN+OVA-fluorescein conjugate for 1 hr. Scale bar =10 µm.
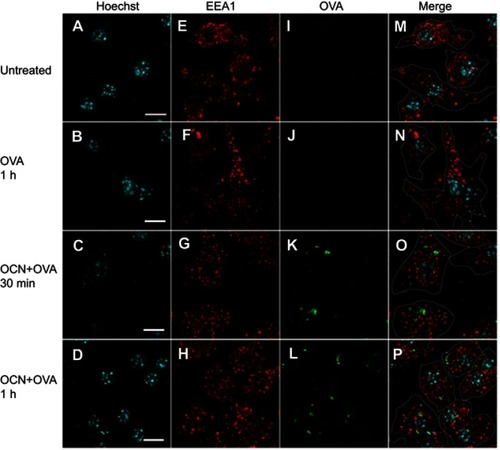
Figure 5 OVA delivered by OCNs did not colocalize with lysosomes. OCN+OVA-fluorescein conjugate (ratio 3:1, green) were incubated with BMDMs. After the indicated incubation times at 37°C, cells were subjected to immunofluorescence staining using rat anti-LAMP1 antibody and anti-rat IgG conjugated Alexa Fluor® 555 for lysosomes (red). Nuclei were stained with Hoechst (blue). Images were acquired by confocal microscopy. (A–D) Hoechst, (E–H) LAMP1 (I-L) OVA-fluorescein conjugate, (M–P) merged images. Scale bar =10 µm.
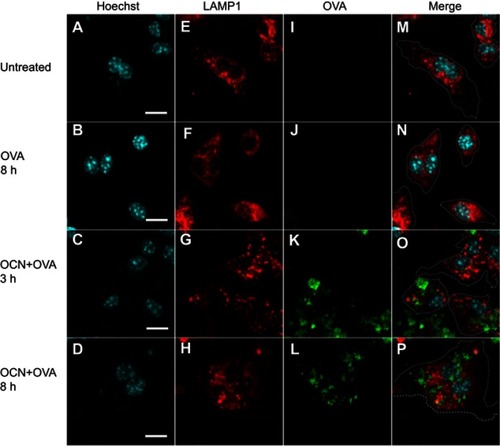
Figure 6 OVA delivered by OCNs did not colocalize with autophagosomes. OCN+OVA-fluorescein conjugate (ratio 3:1, green) were incubated with BMDMs. After the indicated incubation times at 37°C, cells were subjected to immunofluorescence staining using anti-LC3 antibody and anti-rabbit IgG (H+L), F(ab’)2 fragment conjugated with Alexa Fluor® 555 antibody for autophagosomes (red). Nuclei were stained with Hoechst (blue). Images were acquired by confocal microscopy. (A–F) Hoechst, (G–L) LC3, (M–R) OVA-fluorescein conjugate, (S–X) merged images. Scale bar=10 µm.
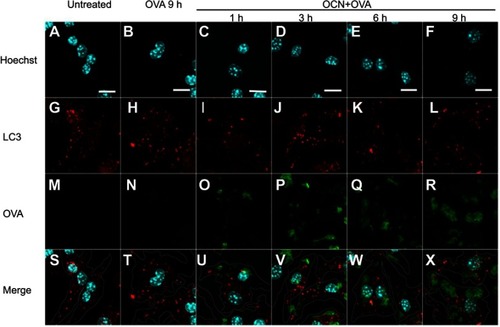
Figure 7 OCNs in combination with MPL increase the frequency of OVA-specific granzyme B+ CD8+ T cells. (A) Immunization regimen. BALB/c mice were immunized with OVA+Poly(I:C), OVA+OCN+Poly(I:C), OVA+MPL or OVA+OCN+MPL via a subcutaneous route three times with 2-week interval. One week after the last immunization, splenocytes were harvested and stimulated with OVA (200 µg/mL) in vitro for 72 hrs. Cells were collected for CD8 staining and intracellular staining for granzyme B staining. (B) The gating strategy to identify the subset of CD8+ granzyme B+ T cells is shown. (C) Representative flow cytometry results are shown. The frequency of CD8+ granzyme B+ T cells in all CD8+ T cells is summarized in (D). Data represent the mean ± SEM. The significance of differences between two groups was determined by two-tailed unpaired Student’s t-test. **p<0.01.
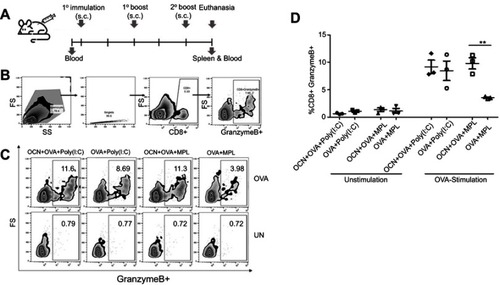
Figure 8 OCNs increased the frequency of IFNγ-producing CD8+ T cells when combined with adjuvant MPL. Splenocytes from mice treated as above were stimulated with OVA as shown in . Cells were collected for intracellular IFN-γ staining and analyzed by flow cytometry. (A) The gating strategy to identify the subset of CD8+ FNγ+ T cells is shown. Representative flow cytometry results are shown. The frequency of CD8+ IFNγ+ T cells in all CD8+ T cells is summarized in (B). Data represent the mean ± SEM. The significance of differences between two groups was determined by two-tailed unpaired Student’s t-test. **p<0.01.
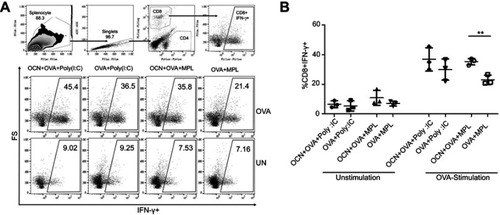
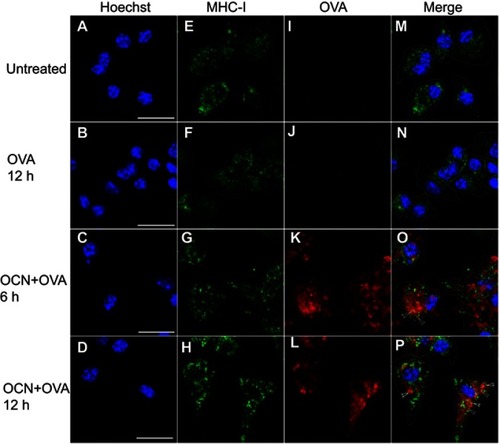
Figure 9 OVA delivered by OCNs colocalized with MHC-I containing compartments. OCN+OVA (ratio 3:1 ratio) were incubated with BMDMs. After the indicated incubation times at 37°C, cells were subjected to immunofluorescence staining using biotin conjugated anti-mouse H2Dd antibody and DyLight 488 conjugated streptavidin for MHC-I staining (green). OVA were detected using rabbit polyclonal anti-OVA antibody and anti-rabbit IgG antibody conjugated with Alexa Fluor® 555 (red). Nuclei were stained with Hoechst (blue). Images were acquired by confocal microscopy. (A–D) Hoechst, (E–H) MHC-I, (I–L) OVA and (M–P) the merged images. Arrow heads indicate colocalization between OVA and MHC-I (yellow). Scale bar =20 µm.