Figures & data
Figure 1 (A) Schematic diagram of synthetic methods. The right side shows the two-step method, and the left side shows the single-step method. (B) Nanoparticle size distribution from DLS measurements. (C) TEM images. (D) Zeta potential distribution from DLS measurements. (E) UV-vis absorption spectrum. (F) FT-IR spectrum.
Abbreviations: DLS, dynamic light scattering; TEM, transmission electron microscopy; UV-vis, Ultraviolet–visible spectroscopy.
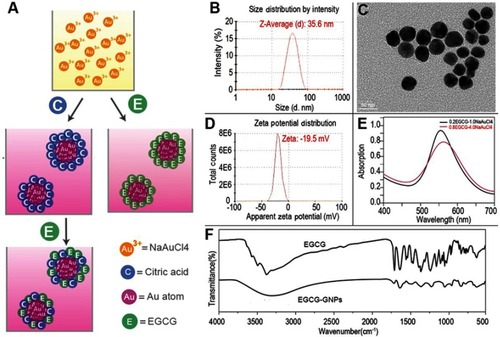
Figure 2 DFT-optimized ligand geometries on the Au(111) model surfaces and in vitro release assay. (A) Free citrate and citrate absorbed on the gold surface. (B) EGCG anion absorbed on the gold surface. (C) Neutral EGCG absorbed on the gold surface. (D) In vitro release of EGCG in PBS (pH 7.4 and pH 6.0) for EGCG-GNP and free EGCG solution. (E) Relative extinction at wavelength 540 nm of EGCG-GNP in 150 mM NaCl, 6% HSA, and their mixture measured at 1 and 24 h.
Abbreviations: DFT, density functional theory; PBS, phosphate buffered saline; HSA, human serum albumin.
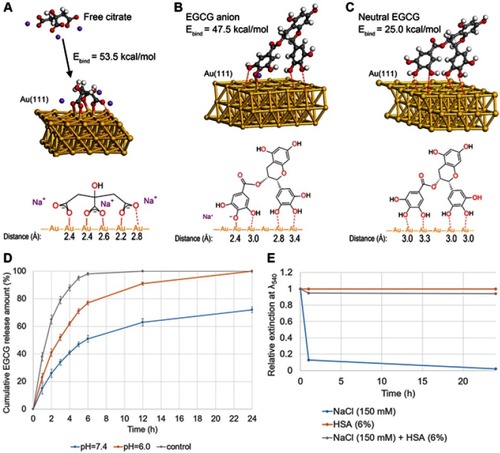
Figure 3 Viability of BMMs in the presence of (A) EGCG and (B) EGCG-GNPs at different concentrations. The results are mean ± SD of triplicate experiments: *P<0.05, significant differences compared with control. (C) Intracellular uptake images of BMMs treated with EGCG-GNPs as confirmed by TEM (black arrows). Enlarged views of C (scale bar =20 μm) are presented in a and b (scale bar =7.5 μm).
Abbreviations: BMM, bone marrow-derived macrophages; TEM, transmission electron microscopy.
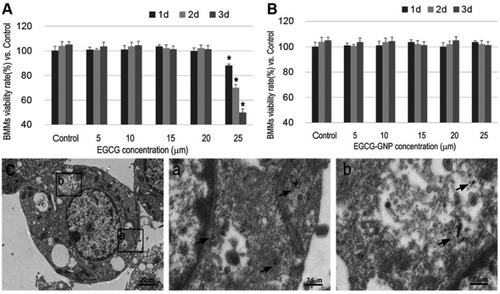
Figure 4 BMMs were stimulated with 100 ng/mL RANKL for 36 h and another 5 days with 1 μg/mL LPS. Together with the stimulator, various concentrations of EGCG or EGCG-GNPs were added. (A) TRAP assay after treatment with EGCG and EGCG-GNPs. Cells stained purple were TRAP-positive. TRAP-positive OCs containing more than three nuclei were counted and shown in the lower left bar graph. (B) Effects of EGCG and EGCG-GNPs on LPS-induced actin formation in BMMs. Cells were stained with FITC-labeled phalloidin (green) and with DAPI (blue). The number of OCs exhibiting ring-like F-actin sealing zones was quantified in the lower left bar graph. Scale bar =200 μm. The results are mean ± SD of triplicate experiments: *P<0.05, **P<0.01, significant difference compared with the LPS group. Abbreviations: RANKL, acceptor activator of nuclear factor kappa-B ligand; LPS, lipopolysaccharides; TRAP, tartrate-resistant acid phosphatase; OC, osteoclast.
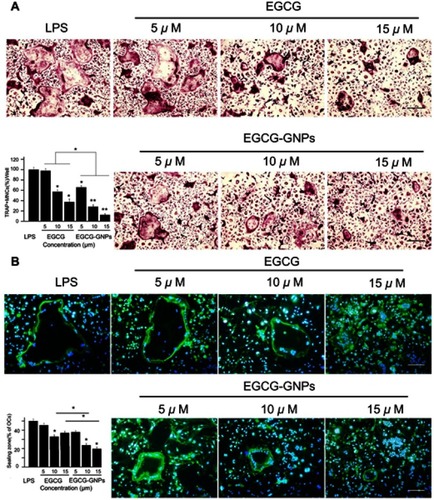
Figure 5 Flow cytometry analysis of intracellular ROS in BMMs. (A) LPS-induced intracellular ROS. The data shown are representative of three independent experiments performed in triplicate. (B) Quantitative analysis for percentage of ROS positive in samples. Percentage of ROS-positive population judged by the threshold in A was calculated from triplicated samples. *P<0.05 vs LPS alone, *P<0.05 between samples.
Abbreviations: BMM, bone marrow-derived macrophages; LPS, lipopolysaccharides; ROS, reactive oxygen species.
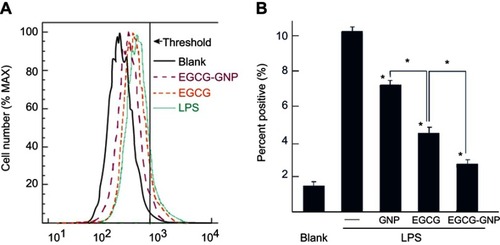
Figure 6 Gene expression of (A) MMP9, (B) NFATc1, (C) TRAP, and (D) cathepsin K relative to blank (1.0 expression, not shown in the figure) in the presence of EGCG (15 μM) or EGCG-GNPs (15 μM). *P<0.05, **P<0.01, significant difference compared between groups.
Abbreviations: LPS, lipopolysaccharides; MMP9, matrix metallopeptidase 9; NFATc1, nuclear factor of activated T-cells cytoplasmic 1; TRAP, tartrate-resistant acid phosphatase.
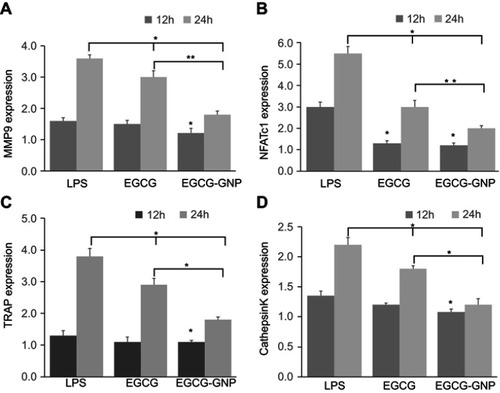
Figure 7 MAPK and NF-κB signaling was related to the EGCG-GNP-inhibited OC differentiation. (A and B) Protein expression levels of phosphorated p38, ERK, JNK, and p65 in the presence of EGCG and EGCG-GNPs were detected by Western blot analysis. (C) Four groups of gray-value analysis of p65 and p-p65 protein expression. Abbreviations: LPS, lipopolysaccharides; MAPK, mitogen-activated protein kinase; NF-κB, nuclear factor kappa-light-chain-enhancer of activated B cells; ERK, extracellular regulated protein kinases; JNK, c-Jun N-terminal kinases.
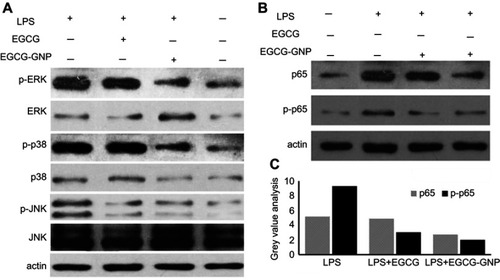
Figure 8 Administration of EGCG and EGCG-GNPs protected against LPS-induced mouse calvarial bone erosion in vivo. Mice were subcutaneously injected 1 day in advance and then 30 min before the daily LPS injection for 7 days. Finally, the mice were sacrificed, and calvariae were removed for fixation. (A) X-ray images. (B). Micro-CT reconstruction images. (C and D). Microarchitecture parameters assessed by micro-CT (*P<0.05). (E) Calvariae were fixed, decalcified, dehydrated, embedded, and sectioned. H&E staining (10×) and TRAP staining (10×, 40×) were performed for each group: (a) PBS, (b) LPS, (c) EGCG, and (d) EGCG-GNPs. Arrowheads indicate OCs. Abbreviations: LPS, lipopolysaccharides; H&E, haemotoxylin and eosin; TRAP, tartrate-resistant acid phosphatase; PBS, phosphate buffered saline; OC, osteoclast; BV/TV, bone volume over total volume; Tb. Th, trabecular thickness.
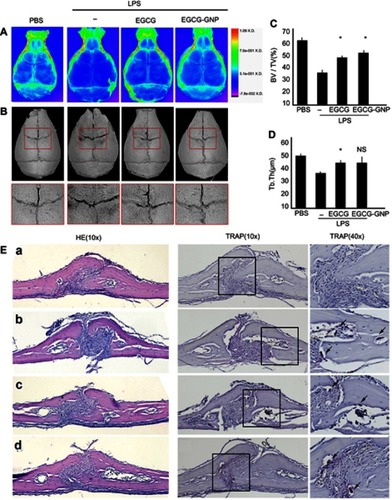
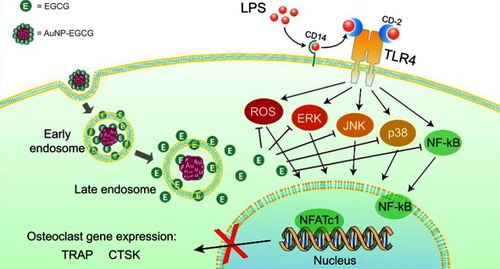
Figure 9 Schematic diagram of functional GNPs covered with EGCG and their possible mechanisms for preventing osteoclastogenesis.
Abbreviations: LPS, lipopolysaccharides; CD, cluster of differentiation; TLR, Toll-like receptors; ROS, reactive oxygen species; NF-κB, nuclear factor kappa-light-chain-enhancer of activated B cells; ERK, extracellular regulated protein kinases; JNK, c-Jun N-terminal kinases; NFATc1, nuclear factor of activated T-cells cytoplasmic 1; TRAP, tartrate-resistant acid phosphatase; CTSK, cathepsin K.