
Figures & data
Table 1 Primers sequence’ used in quantitative real-time PCR assays
Figure 1 Characterization of ZnO-NPs (A) A representative micrograph of ZnO-NPs using TEM showing average particle size=40 nm, (B) XRD pattern of ZnO nanopowder showed peaks at 2θ=31.67°, 34.31°, 36.14°, 47.40°, 56.52°, 62.73°, 66.28°, 67.91°, 69.03° and 72.48°, (C) zeta potential of ZnO-NPs, (D) the hydrodynamic diameter of 100% ZnO-NPs using DLS.
Abbreviations: TEM, transmission electron microscope; XRD, X-ray diffraction; DLS, dynamic light scattering; ZnO-NPs, zinc oxide nanoparticles.
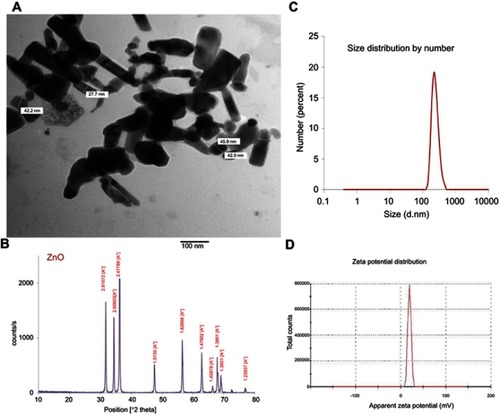
Table 2 Levels of Zn (µg/g) in muscle, liver and kidney of mice treated with different doses of ZnO-NPs (50, 300 and 500 mg/kg) with or without NAC pretreatment
Figure 2 Effects of different ZnO-NPs doses on TV in mm3 and RTV in ESC bearing mice on the 4th and 8th day in different treated groups. The data represent the mean±SE (n=5).
Abbreviations: TV, tumor volume; RTV, relative tumor volume; ESC, ehrlich solid carcinoma; SE; standard error; ZnO-NPs, zinc oxide nanoparticles; NAC, N-acetyl cysteine.
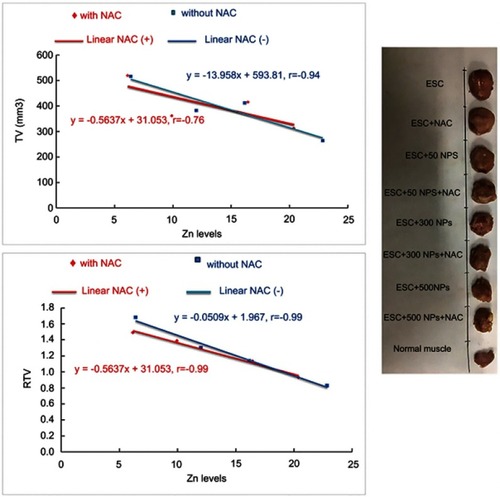
Figure 3 Representative photomicrographs of thigh skeletal muscle tissues of ESC mice treated with different doses of ZnO-NPs (50, 300 and 500 mg/kg) with and without NAC (100 mg/kg) pretreatment. Normal muscle group (NML), (A) ESC group showing necrosis of muscles and masses of chromatophilic tumor cells between the necrotic muscles, (B) ESC+NAC group showing necrosis of chromatophilic tumor cells surrounded by granulation tissue, (C) ESC+50 ZnO-NPs group showing masses of chromatophilic tumor cells between the necrotic muscles, (D) ESC+50 ZnO-NPs+NAC group showing masses of necrotic tumor cells in between necrotic muscle bundles, (E) ESC+300 ZnO-NPs group showing masses of necrotic tumor cells. (F) ESC+300 ZnO-NPs+NAC group showing masses of tumor cells in between muscle bundles, (G) ESC+500 ZnO-NPs group showing masses of chromatophilic tumor cells and giant cells. (H) ESC+500 ZnO-NPs group showing masses of necrotic tumor cells in between muscle bundles (H and E × 100).
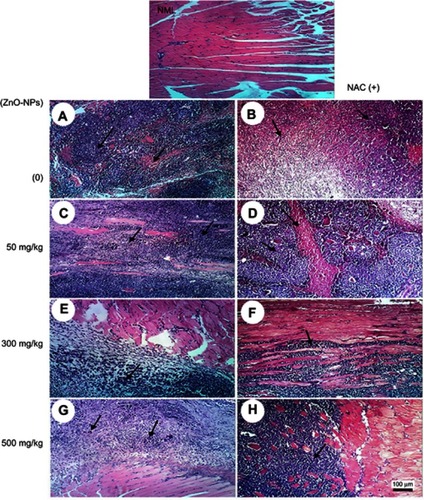
Figure 4 Representative photomicrographs of kidney tissues of mice treated with different doses of ZnO-NPs (50, 300 and 500 mg/kg) with and without NAC (100 mg/kg) pretreatment. (NK) normal kidney group showing no histopathological change, (A) ESC group showing normal histological structure of renal parenchyma, (B) ESC+NAC group showing the normal histological structure of renal parenchyma, (C) ESC+50 ZnO-NPs group showing vacuolation of renal tubular epithelium (black arrow) and presence of protein cast in Bowman’s space (red arrow), (D) ESC+50 ZnO-NPs+NAC group showing vacuolation of epithelial lining renal tubules and hyalinosis of glomerular tuft (E) ESC+300 ZnO-NPs group showing slight congestion of glomerular tufts glomerular tuft, (F) ESC+300ZnO-NPs+NAC group showing no histopathological changes, (G) ESC+500ZnO-NPs group showing focal interstitial mononuclear inflammatory cells infiltration, (H) ESC+500 ZnO-NPs+NAC group showing vacuolation of epithelial lining renal tubules (head arrow) and renal cast in the lumen of renal tubules (H and E × 400).
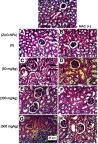
Figure 5 Representative photomicrographs of liver tissues of mice treated with different doses of ZnO-NPs (50, 300 and 500 mg/kg) with and without pretreatment with NAC (100 mg/kg). (NL) normal liver group showing no histopathological change (A) ESC group showing hydropic degeneration of hepatocytes, (B) ESC+NAC group showing hydropic degeneration of hepatocytes, (C) ESC+50 ZnO-NPs group showing hydropic degeneration of hepatocytes, (D) ESC+50 ZnO-NPs+NAC group showing Kupffer cells activation, (E) ESC+300 ZnO-NPs group showing vacuolar degeneration of hepatocytes, (F) ESC+300 ZnO-NPs+NAC group showing vacuolar degeneration of hepatocytes, (G) ESC+500 ZnO-NPs group showing massive mononuclear inflammatory cells infiltration in the portal triad, (H) ESC+500 ZnO-NPs+NAC group showing vacuolar degeneration of hepatocytes and congestion of hepatoportal blood vessel (H and E × 400).
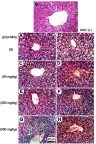
Figure 6 Effects of ZnO-NPs on oxidative stress biomarkers in different treated groups. (A) MDA content (nmol/g tissue), (B) GST activity (mg/g tissue) and (C) CAT activity (U/g tissue). The data are presented as mean±SE (n=5). *Significant difference (P<0.05).
Abbreviations: MDA, malondialdehyde; CAT, catalase; GST, glutathione-s-transferase; ESC, Ehrlich solid carcinoma; NAC, N-acetyl cysteine; ZnO-NPs, zinc oxide nanoparticles.
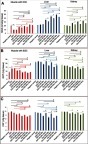
Figure 7 Effects of ZnO-NPs on DNA damage parameters in all treated groups. (A) tail length (TL) in µm, (B) % of DNA damage and (C) tail moment (TM). The data represent the mean±SE (n=5). *Significant difference (P<0.05).
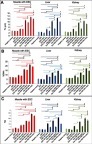
Figure 8 Representative fluorescent microscope photomicrographs demonstrating the extent of DNA damage assessed by alkaline comet assay in muscle with ESC, liver and kidney cells of tumor-bearing mice.
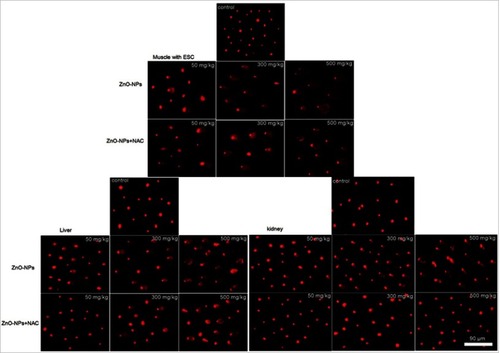
Figure 9 The relative mRNA expression of apoptosis-related genes (P53, Bax and Bcl2) in all treated groups determined by q-PCR. Data expressed relative to the housekeeping gene Gapdh, normalized to the control group. The data represent the mean±SE (n=5). *Significant difference (P<0.05).
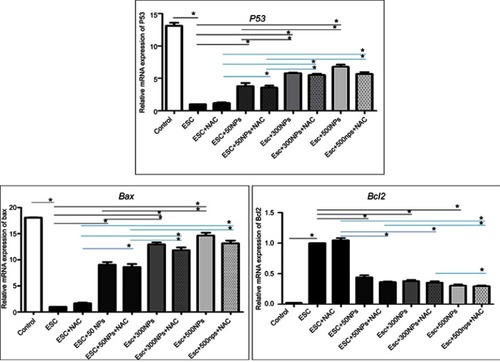
Figure 10 Photomicrographs representing immunohistochemistry staining of P53 expression in ESC muscle sections and showing (A) negative staining of P53 in ESC of untreated ESC group. (B) negative staining of P53 in ESC+NAC group. (C and D) ZnO-NPs (50 mg/kg) alone or combined with NAC, respectively, with moderate P53 expression. (E and F) ZnO-NPs (300 mg/kg) alone or combined with NAC, respectively, with an increase in P53 expression while groups (G and H) ZnO-NPs (500 mg/kg) alone or combined with NAC, respectively, with the highest level of P53 expression; 400× magnification.
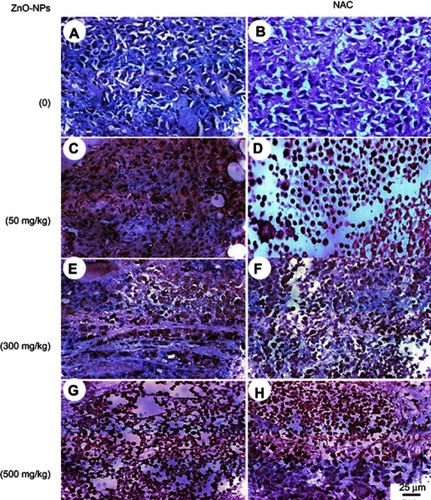
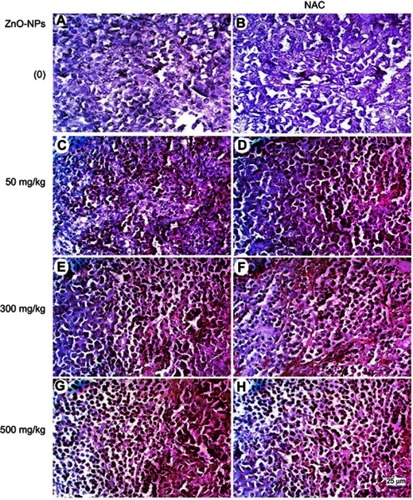
Figure 11 Photomicrographs represent immunohistochemistry staining of caspase-3 expression in ESC muscle sections showing (A) Negative staining of caspase-3 in ESC of untreated ESC group. (B) Negative staining of caspase-3 in ESC+NAC group. (C and D) ZnO-NPs (50 mg/kg) alone or combined with NAC, respectively, with moderate caspase-3 expression. (E and F) ZnO-NPs (300 mg/kg) alone or combined with NAC, respectively, show an increase in caspase-3 expression while groups. (G and H) ZnO-NPs (500 mg/kg) alone or combined with NAC, respectively, with the highest level of caspase-3 expression; 400× magnification.
Data availability
Raw data supporting the results reported in the manuscript are available with the authors.