Figures & data
Figure 1 Diameter and ς-potential of MNPs with or without PEG. Particle size and ζ-potential of MNPs were measured in phosphate-buffered saline (PBS, A) or serum (B). The values shown are mean ± SE (n=3–4). *,#p<0.05 compared with the corresponding 250 nm particles and PEG(–) groups, respectively.
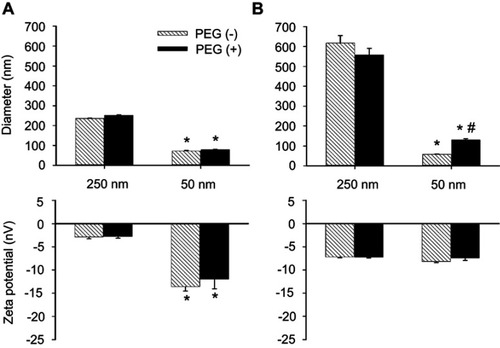
Figure 2 Magnetic capture of MNP and subsequent flow changes in microvessels. MNPs (5 mg/kg, 250 nm) were administered intra-arterially to the left cremaster muscle with an NdFeB magnet placed underneath. MNP accumulation 1 to 14 mins after administration is illustrated as flux and photo images. The arrow in the flux images indicates the flow direction of the adjacent vessel. Representative capture of MNP in a microvessel with time were observed, followed by removal of the magnet (-Mag) 14 mins after MNP administration. Scale bar indicates 0.3 μm.
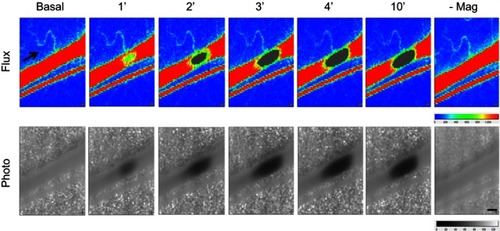
Figure S2 Magnetic capture of MNP and subsequent flow changes in microvessels. MNPs (5 mg/kg) were administered intra-arterially to the left cremaster muscle with a NdFeB magnet placed underneath. MNP accumulation 1 to 14 mins after administration is illustrated as flux and photo images. The arrow in the flux images indicates the flow direction of the adjacent vessel. Patterns of magnetic capture of MNPs in microvessels (A–H) were observed.
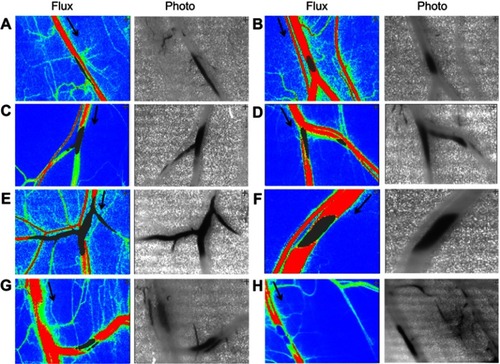
Figure 3 Two-dimensional hemodynamic effects of magnetic capture of PEGylated MNPs in microvessels. RBC flow in cremaster microvessels of individual rats with administration of MNPs of 250- (A–C) or 50- (D–F) nm with (+) or without (−) PEG, as indicated, was monitored in a real-time manner. The arrowheads indicate administration of the particles. Speckle images of flow (Flux) with sites of flow acquisition are shown after administration of the particles (B and E; 5 mg/kg; +MNP) and subsequent magnet removal (-Mag). Effects of PEGylation on magnetic capture of MNPs are summarized (C and F; n=9–23). *,#,†P<0.05 compared with the corresponding basal, PEG(−) and +MNP groups, respectively.
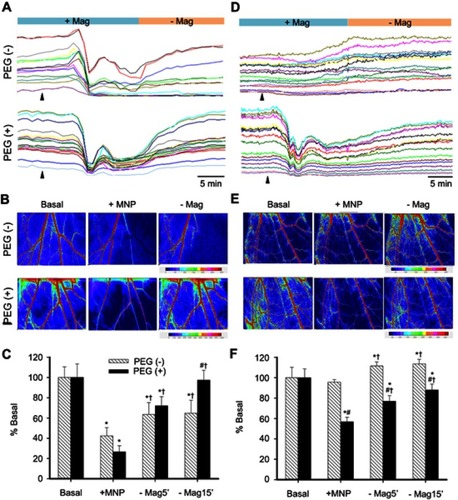
Figure 4 Dynamic retention of MNP with PEG in the representative vessels in magnetic field. Magnetic capture of PEG(+) MNPs (250 nm; 5 mg/kg) in cremaster microcirculation was observed by capillaroscopy under gray and color mode 12–19 mins after administration of the MNPs and 1 min after removal of the magnet (-Mag). The red arrows indicate the flow direction of the adjacent vessel. The results are representative of 6 experiments. Scale bar indicates 50 μm.
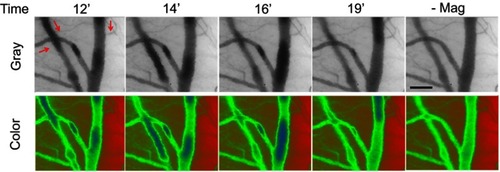
Figure S3 Dynamic retention of MNP with PEG in the representative vessels without magnetic field. Without magnetic capture of PEGylated MNPs (250 nm; 5 mg/kg) in cremaster microcirculation was observed by capillaroscopy under gray and color mode 12–19 mins after administration of the MNPs. The red arrows indicate the flow direction of the adjacent vessel. The results are representative of 6 experiments. Scale bar indicates 50 μm.
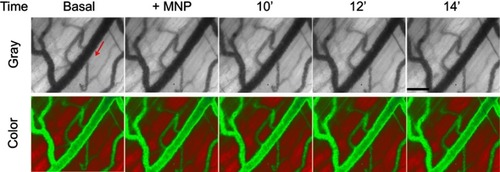
Figure 5 Effects of size and PEGylation on retention of particles subjected to serum/RBC flow and magnetic field. In vitro circulation system (A) was established to observe particle retention in hydroxyethyl starch/RBC solution (B) or serum (C, D, E) at 2 mL/min and magnetic field. Summarized 2-D retention of particles of 50 vs 250 nm are presented in (D) and (E), respectively (n=3). Values are mean ± SEM. *p<0.05 compared with the corresponding PEG(−) groups, respectively.
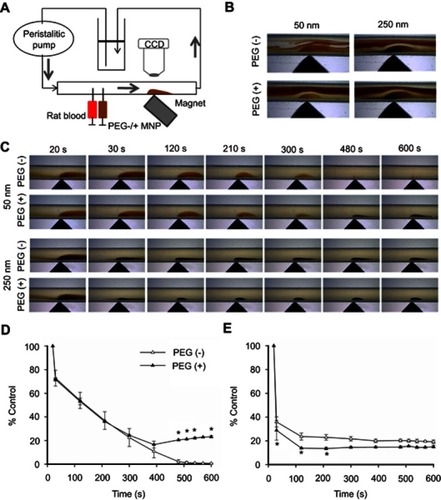
Figure 6 PEGylation attenuated MNP interaction with cultured endothelial cells. Human umbilical vein endothelial cell (HUVEC)-associated MNP was determined after incubation of 250 nm MNP (100 μg/mL; 19.7 μg/cm2) in the absence (-Mag) and presence (+Mag) of the magnet for up to 6 hrs after application of the magnet for 5 mins to facilitate sedimentation. Values are presented as mean ± SE (n=7). *,#P<0.05 compared with the corresponding control (0 hrs) and PEG(−) groups, respectively.
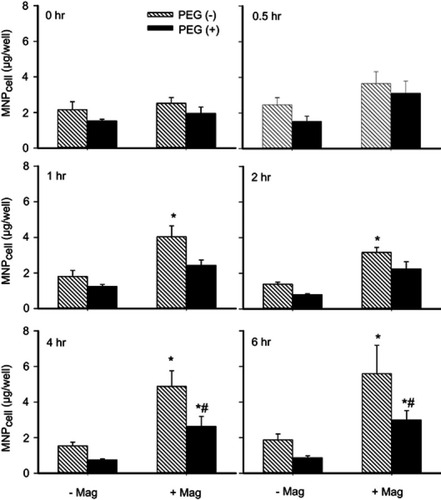
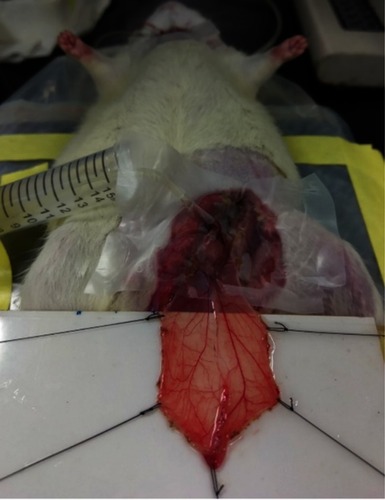
Figure S1 Cremaster muscle preparation of an anesthetized rat. Left cremaster muscle was spread with tension created by suture on a home-made platform. The muscle preparation was then subjected to laser speckle contrast imaging or cappillaroscipy from above.