Figures & data
Table 1 Characterization of SRLV-1, SRLV-2, SRLV-3 and GVM
Figure 1 Mechanisms of VCR drug loading. (A) Schematic of the active loading method of vincristine sulfate into preformed liposomes using a TEA-SOS gradient. VCR forms a gel-like precipitate due to the presence of SOS- inside the liposome. (B) Schematic of the active loading method of vincristine sulfate into performed liposomes using a pH gradient. Detailed descriptions of the method and processes are given in the text.
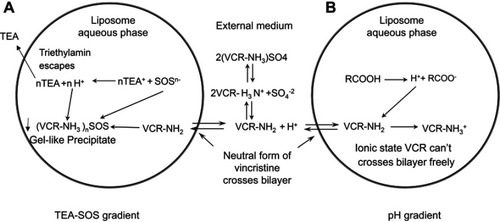
Figure 2 Cryo-EM micrographs of VCR liposome formulations. (A–C) SM/Chol/mPEG-DSPE (79/20/1, w/w) liposomes using a TEA-SOS gradient for VCR loading at different drug/lipid ratios of 1/10 (A), 1/5 (B) and 1/2 (C). (D) SM/Chol (73.5:29.5, w/w) liposome using a pH gradient for VCR loading.
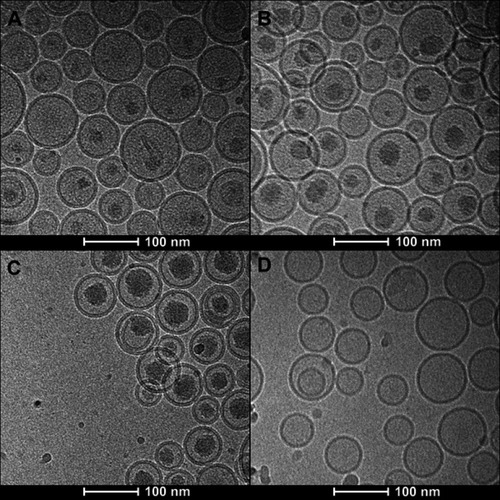
Figure 3 The changes of encapsulation efficiency (A and C) and vincristine sulfate concentration (B and D) for VCR liposome formulations. The formulations were stored in the time of 0, 1, 3, 6 and 12 months at 2–8°C (A and B) and in the time of 0, 1, 2 and 3 months at 25±2°C/60% ±5% RH (C and D).
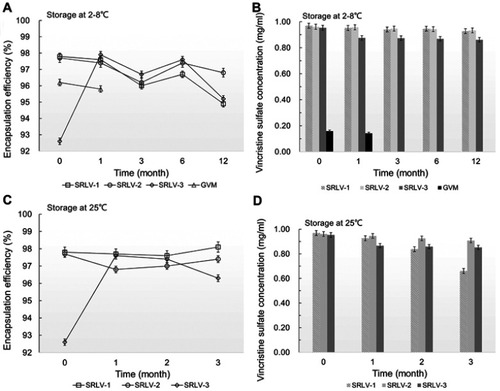
Figure 4 In vitro release of VCR liposome formulations in medium. (A) In vitro release of SRLV-1, SRLV-2, SRLV-3, and GVM in HEPES/NaCl serum solution (pH 7.2) at 37°C after 0.5, 2, 4, 8, 12, and 24 h incubation. (B and C) In vitro release of SRLV-1, SRLV-2 and SRLV-3 in triethylamine chloride/histidine solution (pH 6.5), at 37°C (B) or 42°C (C) after 0.5, 2, 4, 8, 12, and 24 h incubation.
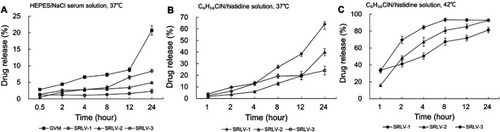
Table 2 Pharmacokinetics parameters of VCR liposome formulations in rats
Figure 5 The plasma concentration of vincristine of VCR liposome formulations in rats after a single dose of 1 mg/kg intravenous injection. Blood samples were taken from retro-orbital plexus at 0.03, 0.5, 1, 2, 4, 8, 12, 24, and 48 h after injection. Data are expressed as mean ± SD (n=10).
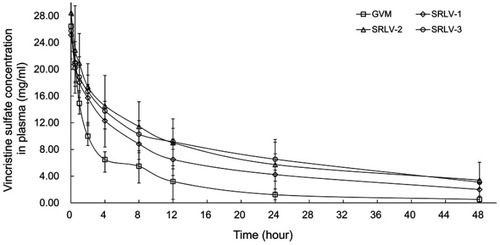
Table 3 Single dose and multi-dose toxicity studies of VCR liposome formulations in rats
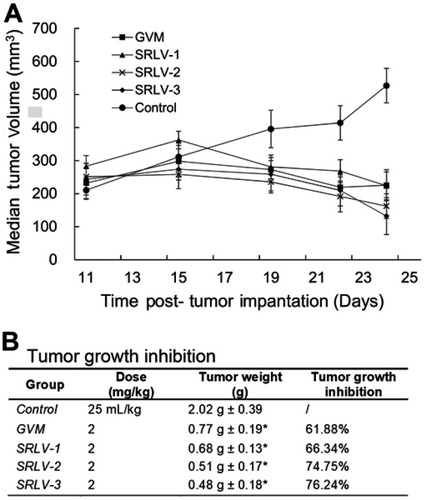
Figure 6 Antitumor activities of VCR liposome formulations on male BALB/c nude mice bearing human melanoma (NHEM) model. Therapeutic effects are shown as tumor volume change (A) and tumor growth inhibition (B). NHEM tumors were implanted in the dorsal flank of nude mice as described in Materials and methods. Once tumors were appropriately sized (∼250 mm3), mice were treated with VCR liposome formulations at a dose level of 2 mg/kg at day 1, day 5, and day 9. The control group was given 25 mL/kg saline solution i.v. on the same day. All mice began treatment on day 11 after tumor implantation. Tumor weight was recorded at day 14 post-administration. Data represented as mean ± SD (n=6). *p<0.05 as compared to control.