Figures & data
Table 1 Mean particle size, polydispersity index (PDI), zeta potential, and entrapment efficiency % (EE%) of pDNA-loaded chitosan-sodium deoxycholate (CS-DS) nanoparticles
Figure 1 Transmission electron microscopy image of pDNA-loaded chitosan-sodium deoxycholate nanoparticles (A) F10 and (B) F15.
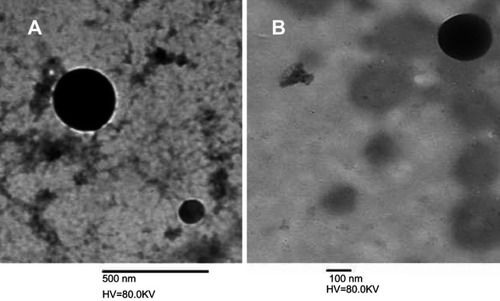
Figure 2 Electrophoretic analysis of the free pDNA and pDNA loaded chitosan-sodium deoxycholate (CS-DS) nanoparticles, lane1: free pDNA, lane 2–6: pDNA-loaded CS-DS nanoparticles (F6–F10, respectively).
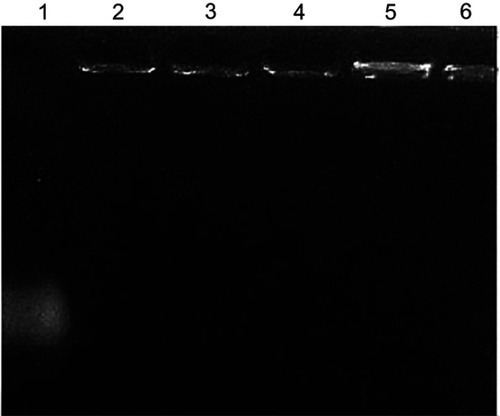
Figure 3 In vitro release profiles of pDNA from different formulations prepared from chitosan-sodium deoxycholate nanoparticles with 30% of pDNA (F5, F10, F15, and F20).
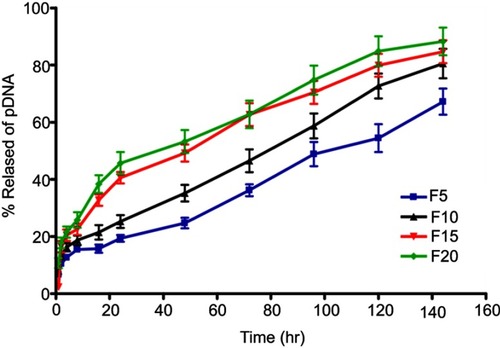
Table 2 Mean particle size, zeta potential, and entrapment efficiency % (EE%) of F10 and F15 before and after storage at 4°C
Figure 4 In vitro cytotoxicity on Caco-2 cells of (A) plain chitosan-sodium deoxycholate (CS-DS) nanoparticles (represented as CS concentration) and (B) pDNA-loaded CS-DS nanoparticles (F10) compared to naked pDNA.
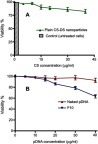
Figure 5 Fold expression of p53 gene in Caco-2 cells treated with naked pDNA and pDNA-loaded chitosan-sodium deoxycholate nanoparticles (F10).
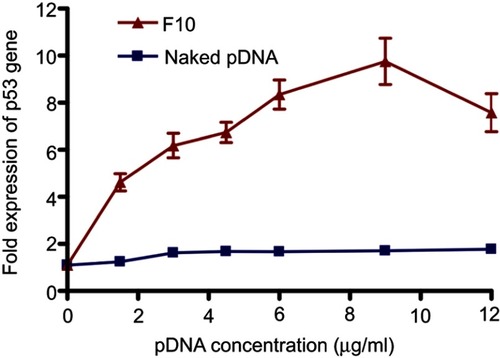
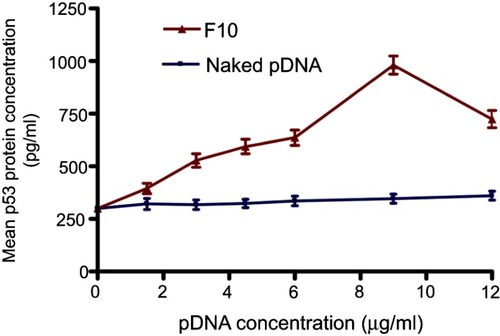
Figure 6 Mean p53 protein concentrations (±SD, n=3) in Caco-2 cells treated with naked pDNA and pDNA-loaded chitosan-sodium deoxycholate nanoparticles (F10).