Figures & data
Table 1 Physicochemical characteristics of unloaded (Nano.Alg) and miltefosine-loaded (MFS.Alg) alginate nanoparticles before and after the freeze-drying process
Figure 1 Transmission electron microscopy (A, B) and scanning electron microscopy (C, D) of alginate nanoparticles. Unloaded (Nano.Alg) (A, C) and miltefosine-loaded (MFS.Alg) (B, D) nanoparticles. Bars in (A) and (B): 2 μm; bars in (C) and (D): 0.5 μm.
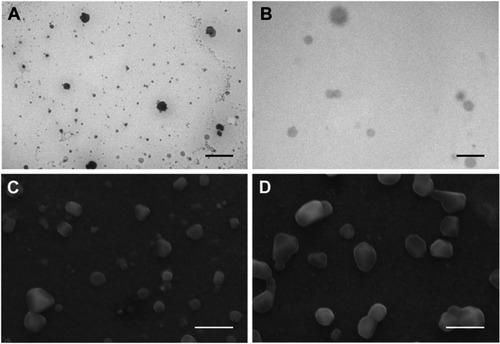
Figure 2 Release of miltefosine (MFS) from alginate nanoparticles. In vitro release at 37 °C, with constant agitation (200 rpm).
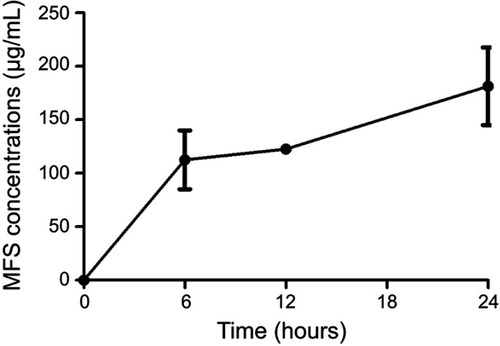
Figure 3 Toxicity of free miltefosine (MFS) and miltefosine-loaded alginate nanoparticles (MFS.Alg) in Galleria mellonella larvae. *P<0.05 when compared with untreated larvae (PBS group). Unloaded alginate nanoparticles (Nano.Alg) were also tested and no toxicity was observed.
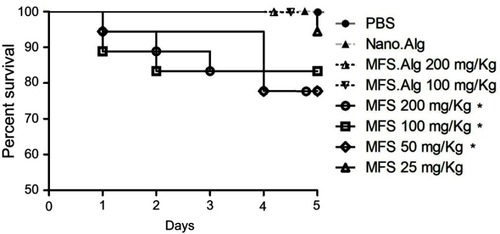
Table 2 Susceptibility of Candida spp. and Cryptococcus spp. strains to fluconazole (FLC), amphotericin B (AMB), free miltefosine (MFS) and miltefosine-loaded alginate nanoparticles (MFS.Alg)
Figure 4 Survival curves of Galleria mellonella larvae infected with yeasts and treated 30 mins post-infection with free miltefosine (MFS) and miltefosine-loaded alginate nanoparticles (MFS.Alg). (A) Candida albicans SC5314, (B) Candida albicans IAL-40, (C) Cryptococcus neoformans H99, (D) Cryptococcus gattii ATCC 56990. P-values when compared with the untreated group.
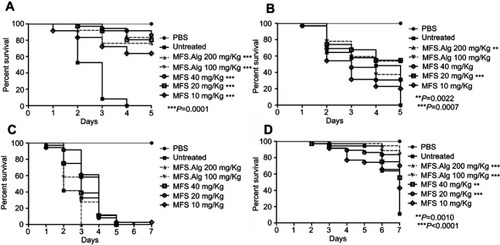
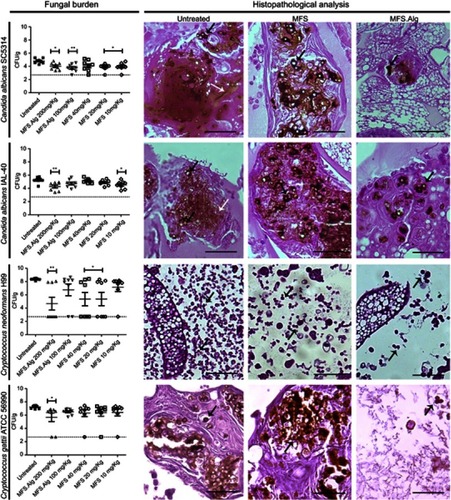
Figure 5 Fungal burden and histopathological analysis of Galleria mellonella larval tissue infected with yeasts and treated or not with free miltefosine (MFS) and miltefosine-loaded alginate nanoparticles (MFS.Alg). Fungal burden data is represented by the mean ± standard deviation. *P<0.05 and **P<0.01 when compared with the untreated group (one-way ANOVA with Dunnet’s post-test). Fungal burden, filamentation and dissemination of yeasts in Galleria mellonella larvae were analyzed by visualization of larval tissue histological sections of larvae untreated, treated with MFS (40 mg/kg), or treated with MFS.Alg (200 mg/kg). Black arrows indicate yeasts and white arrows indicate C. albicans filamentation. Bars: 50 μm.