Figures & data
Figure 1 Pattern diagram of Fe3O4@MTX MNPs synthesis process.
Notes:OA was chemisorbed on the surface of the Fe3O4 MNPs, MTX dispersed into the OA shell surrounding Fe3O4 MNPs, and the Pluronic F-127 that anchored at the OA-water interface conferred aqueous dispersity to the system.
Abbreviations: MNPs, magnetic nanoparticles; OA, oleic acid.
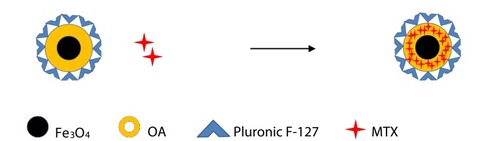
Figure 2 Characterization of Fe3O4@MTX composite magnetic nano drug-loading system. (A) Transmission electron microscopy image of Fe3O4 MNPs carrier; (B) Hydrodynamic diameter and particle size distribution of Fe3O4@MTX MNPs obtained by nanoparticle tracking analysis; (C) The hysteresis loops of Fe3O4 MNPs and Fe3O4@MTX MNPs (insert); (D) Zeta potential of Fe3O4 MNPs, OA-Fe3O4 MNPs, Pluronic-F127/OA Fe3O4 MNPs and Fe3O4@MTX MNPs.
Abbreviations: MNPs, magnetic nanoparticles; OA, oleic acid.
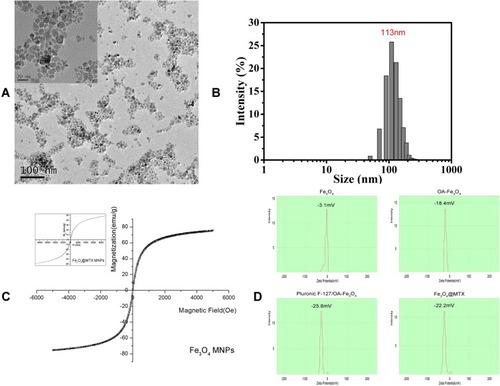
Table 1 Encapsulation Efficiency and Drug Loading Efficiency of MTX
Figure 3 Encapsulation efficiency and drug loading efficiency of MTX detected by UV-VIS-NIR spectrophotometer.
Note: When drug loading efficiency was 15%, drug encapsulation efficiency reached the maximum value of 60.9%.
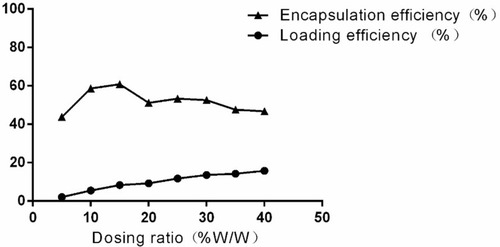
Figure 4 Drug release curve of Fe3O4@MTX MNPs at different temperatures.
Note: The drug release occurred in two phases: an initial burst release within 12 hrs and a sustained release after that.
Abbreviation: MNPs, magnetic nanoparticles.
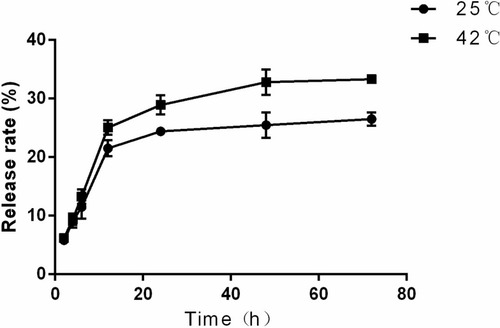
Figure 5 Heating capacity of MNPs at alternating magnetic field (A) Heating curve of Fe3O4 MNPs (0.5, 1.0, 1.5mg Fe/mL); (B) Heating curve of Fe3O4@MTX MNPs compared with Fe3O4 MNPs and ddH2O (1.0mg Fe/mL).
Abbreviation: MNPs, magnetic nanoparticles.
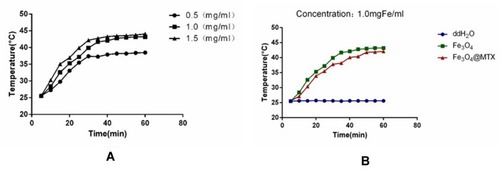
Figure 6 Biocompatibility of Fe3O4 MNPs carrier (A) Inverted microscopy images of 3T3 cells incubated with Fe3O4 MNPs and Fe3O4@MTX MNPs; (B) CCK-8 assay of Fe3O4 MNPs and Fe3O4@MTX MNPs.
Abbreviations: MNPs, magnetic nanoparticles; CCK-8, cell counting kit-8.
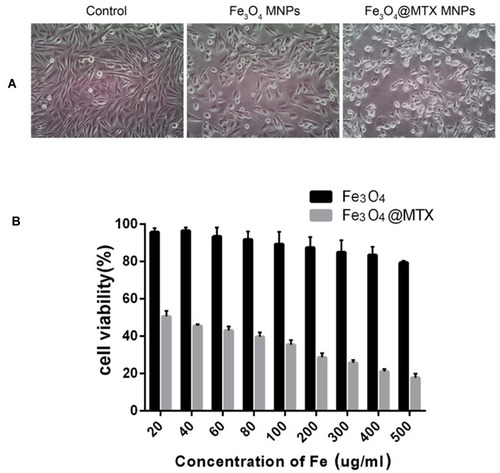
Figure 7 Genotoxicity of Fe3O4 MNPs carrier.
Notes: n = 10. aP > 0.05, MN formation rates of Fe3O4 MNPs groups compared with negative control; bP < 0.05, MN formation rates between Fe3O4 MNPs groups and positive control.
Abbreviations: MN, micronucleus; PEC, polychromatic erythrocytes, MNPs, magnetic nanoparticles.
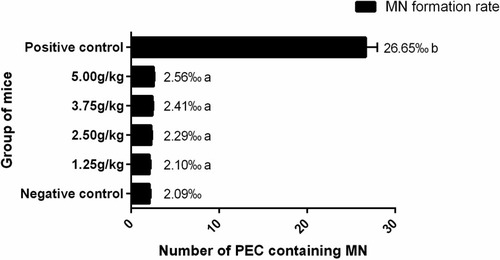
Table 2 Acute Toxicity Test for Detecting LD50 of Fe3O4@MTX MNPs
Figure 8 The labeling effect of Fe3O4@MTX MNPs on OCI-LY18 cells by Perls.
Note: Fe3O4@MTX MNPs could get into OCI-LY18 cells, 10×100 magnification.
Abbreviation: MNPs, magnetic nanoparticles.
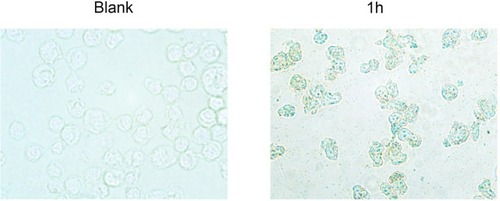
Figure 9 Apoptosis rate of OCI-LY18 cells determined by flowcytometry.
Notes: Apoptosis rate: control group (7.21±3.68%), Fe3O4 MNPs group (13.87±1.36%), MTX group (31.35±3.02%), Fe3O4@MTX MNPs group (28.51±0.99%), Fe3O4 MNPs with hyperthermia group (17.22±2.71%), Fe3O4@MTX MNPs with hyperthermia group (52.00±5.50%). P<0.01, Fe3O4+H vs Control and FE3O4 groups; P<0.01, Fe3O4@MTX+H vs MTX and Fe3O4@MTX groups.
Abbreviation: MNPs, magnetic nanoparticles.
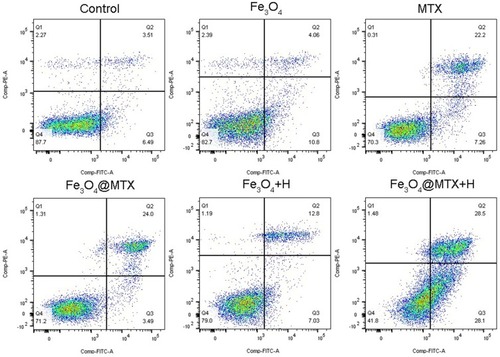
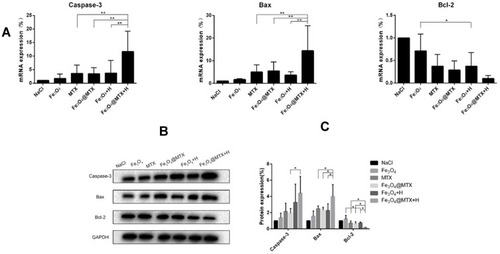
Figure 10 qPCR and Western blot analyses of OCI-LY18 cells after different treatments. (A) Transcription of Caspase-3, Bax and Bcl-2 genes were detected by qPCR; (B) Expression of Caspase-3, Bax and Bcl-2 proteins were detected by Western blot.
Notes: * P<0.05; ** P<0.01.
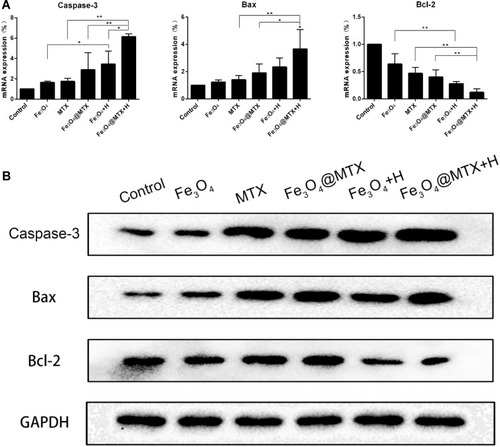
Figure 11 MRI detection of targeting and treatment effect. (A) Low signal region showed that MNPs could concentrated at tumor site after the application of a magnet; (B) MRI images after different treatment effects; (C) Volume of tumors in various treatment groups.
Notes: Low signal region indicated by the arrow in shows MNPs could target tumor tissues under the guidance of external magnetic field; High signal regions indicated by the arrows in show tumors after various treatments; * P<0.05.
Abbreviation: MNPs, magnetic nanoparticles.
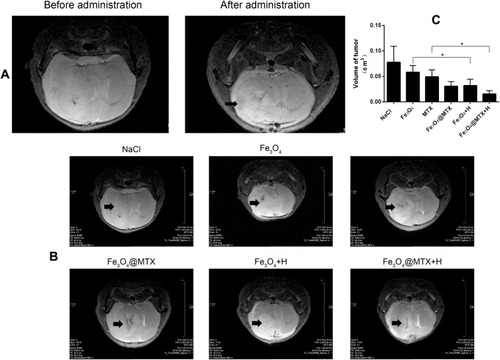
Figure 12 Histopathologic changes in various treatment groups.
Notes: Hematoxylin & eosin staining, 10×100 magnification. The arrows illustrate tumor cells disappear at these areas.
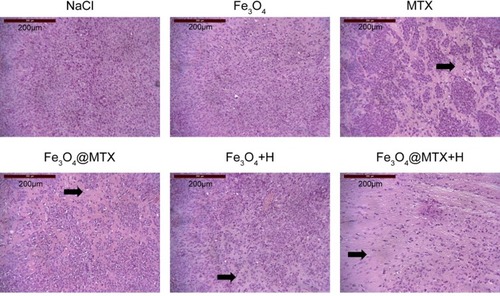
Figure 13 qPCR and Western blot analyses of tumor tissues after different treatments. (A) Transcription of Caspase-3, Bax and Bcl-2 genes were detected by qPCR; (B) Expression of Caspase-3, Bax and Bcl-2 proteins were detected by Western blot; (C) Semi-quantitative results of Caspase-3, Bax and Bcl-2 proteins.
Notes: * P<0.05; ** P<0.01.