Figures & data
Figure 1 Dentinal tubule occlusion of dentine discs after treatment with a dentifrice for 7 days (SEM, 5000×).
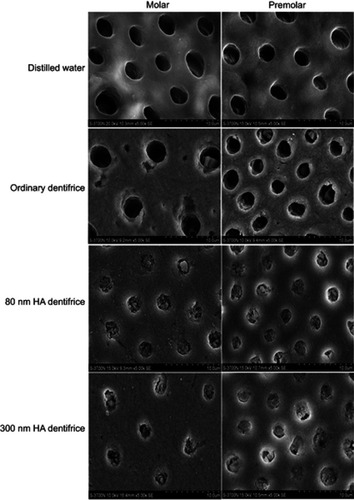
Figure 2 Dentinal tubule occlusion treated by mechanical brushing with distilled water for 7 days (SEM, 5000×).
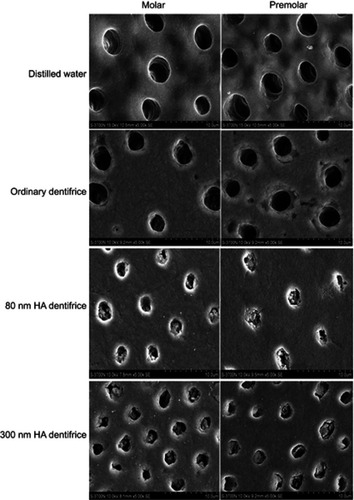
Figure 3 The plugging rates of dentinal tubules treated with a dentifrice for 7 days (Molar group: χ2=59.430, P=0.000; Premolar group: χ2=57.147, P=0.000; *P<0.05).
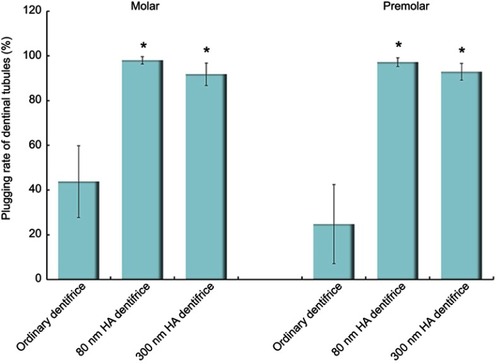
Figure 4 Dentinal tubules after mechanical brushing with distilled water for 7 days (Molar group: χ2=52.585, P=0.000; Premolar group: χ2=56.314, P=0.000; *P<0.05).
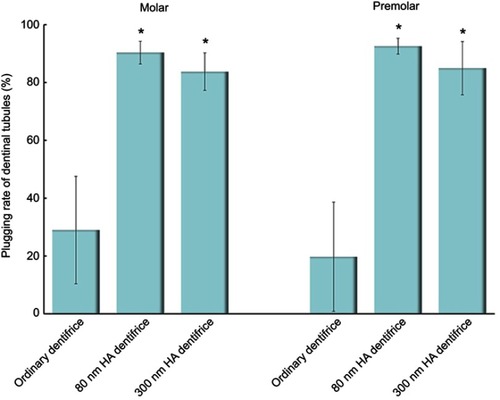
Figure 5 Atomic percentages of calcium and phosphorus in dentin in the molar group (Ca: χ2=33.244, P=0.000; P: χ2=33.518, P=0.000; *P<0.05).
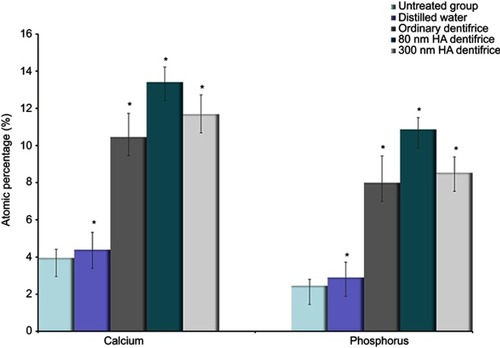
Figure 6 Atomic percentages of calcium and phosphorus in dentin in the premolar group (Ca: χ2=33.637, P=0.000; P: χ2=33.855, P=0.000; *P<0.05).
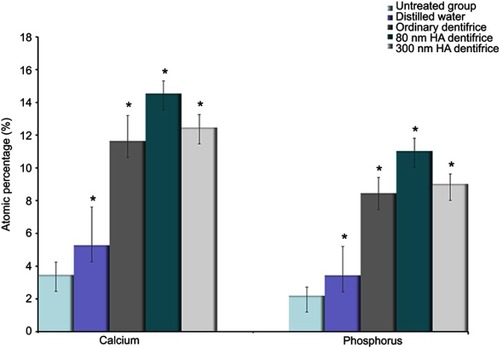
Figure 7 Adsorption capacity of a dentifrice. (A) Adsorption capacity of a dentifrice for Cr6+ at 1 day. (B) Adsorption of Cr6+ by the 80 nm HA dentifrice at 1, 14, and 28 days. (C) Adsorption of Cr6+ by the 300 nm HA dentifrice at 1, 14, and 28 days. (D) Adsorption of Cr6+ by an ordinary dentifrice at 1, 14, and 28 days.
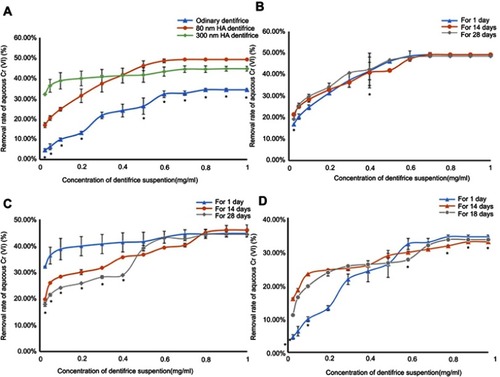
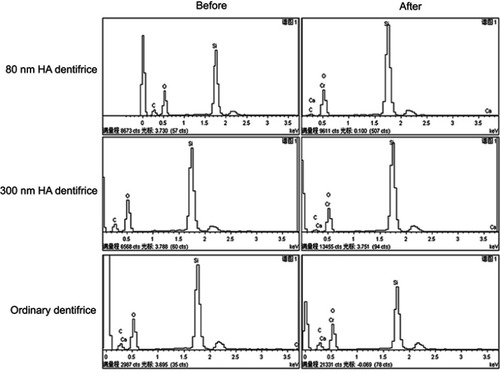
Figure 8 EDS spectra before and after dentifrice adsorbed Cr6+. The horizontal axis represents the value of the voltage (keV) at which different elements can be excited. The findings comparing between before/after diagrams for each group showed that there was chromium in the powder which was further confirmed that the HA dentifrice could adsorb Cr6+.