Figures & data
Figure 1 (A) The energy spectrum of 106Ru/106Rh1717 and (B) CCB concave model of 106Ru eye applicator.
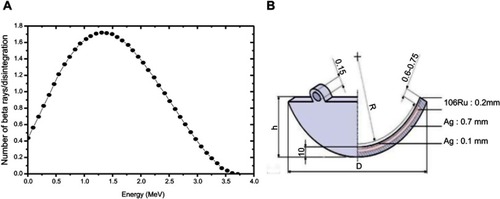
Figure 2 Eye geometry defined in the MCNPX simulation code and CCB applicator sewn on the sclera.
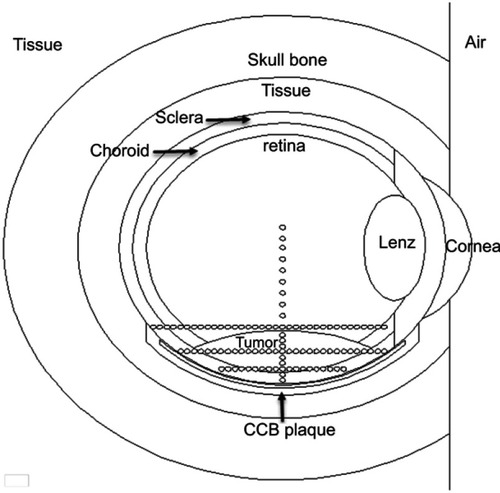
Figure 3 Experimental phantom (left) and CCB plaque along with EBT2 film on the phantom in the experimental dosimetry (right).
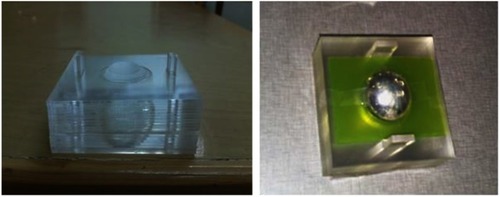
Figure 4 RDD of simulation and experiment, normalized at 3 mm distance from the plaque.
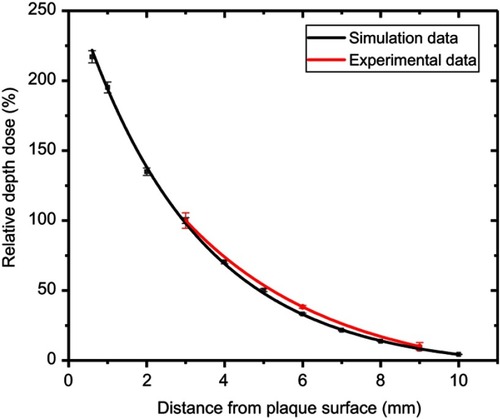
Figure 5 Dose rate comparison between manufacturer and simulation data.
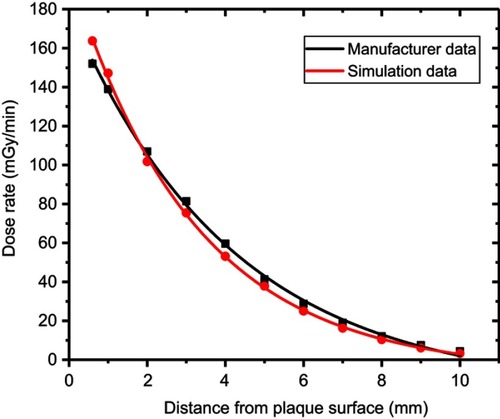
Figure 6 Simulation results for Plexiglas and water phantom.
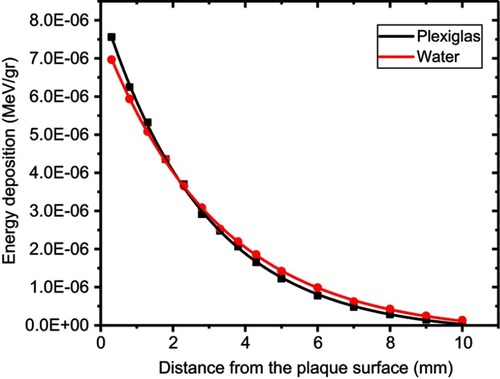
Figure 7 PDD comparison with and without different GNP’s concentration.
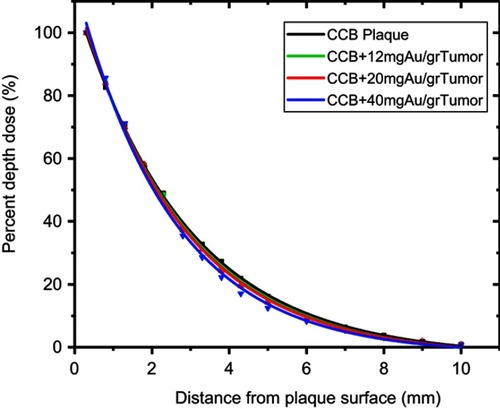
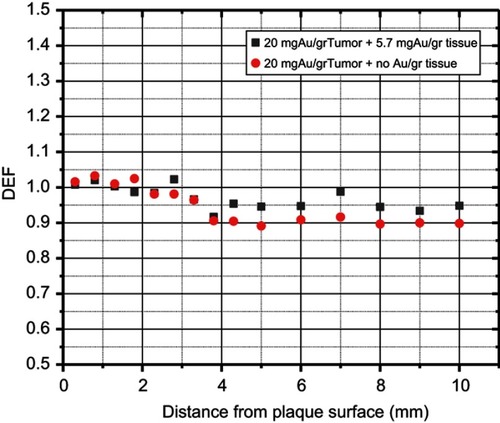
Figure 8 Dose enhancement factor for different concentration of GNPs.
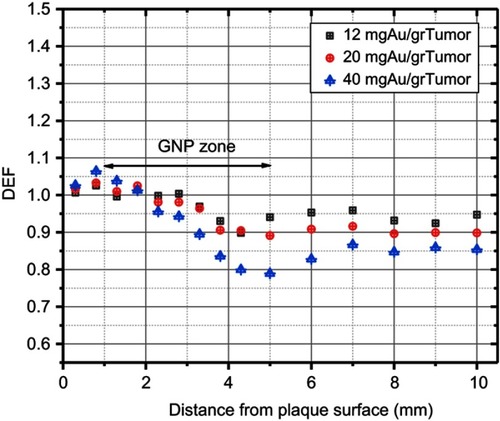
Figure 9 Energy deposition profile in three distance of plaque: (up-left) 1.3 mm and in the tumor base, (up-right) 3 mm and in the tumor middle, (down) 5 mm and in the tumor apex.
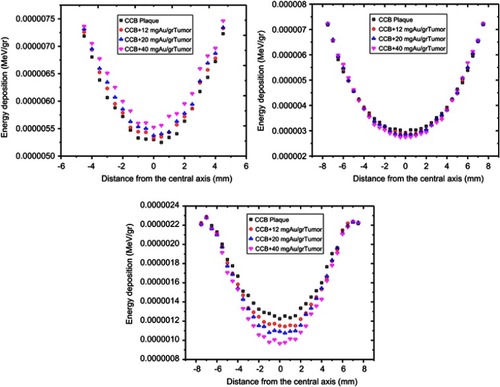
Figure 10 Energy deposition in tumor cell (left) and sclera (right) at different concentration of GNPs.
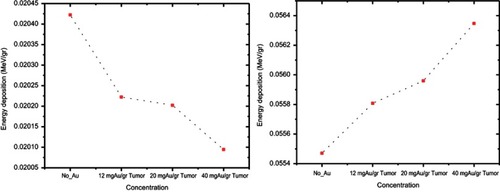
Figure 11 Effect of 5.7 mgAu/grTissue in the tissues outside the tumor for 20 mgAu/grTumor inside the tumor. DEFs were measured at the central axis of plaque.