Figures & data
Figure 1 SEM micrographs and AFM images of TNS and TNS-MAP.Notes: (A–C) TNS surface, and (D–F) TNS-MAP surface.
Abbreviations: SEM, scanning electron microscopy; AFM, atomic force microscopy; TNS, titanium with nanonetwork structures; TNS-MAP, titanium with nanonetwork structures coated with mussel adhesive protein.
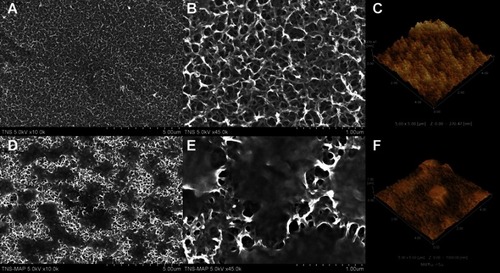
Figure 2 Comparison of contact angle measurements for pure Ti, TNS, and TNS-MAP.Notes: Contact angles of Ti, TNS, and TNS-MAP were measured with a VSA2500 XE contact angle measurement system after application of 2 µL ddH2O to the sample surface at room temperature (***P<0.001; *P<0.05).
Abbreviations: Ti, titanium; TNS, titanium with nanonetwork structures; TNS-MAP, titanium with nanonetwork structures coated with mussel adhesive protein.
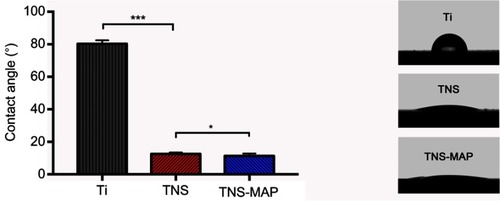
Figure 3 Surface chemical compositions of specimens examined by XPS.
Abbreviations: XPS, X-ray photoelectron spectroscopy; TNS, titanium with nanonetwork structures; TNS-MAP, titanium with nanonetwork structures coated with mussel adhesive protein.
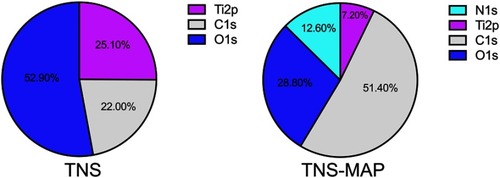
Figure 4 FTIR analysis of TNS and TNS-MAP.Notes:(A) cm−1 from 1,000 to 4,000, and (B) cm−1 from 1,350 to 1,750.
Abbreviations: FTIR, Fourier transform infrared spectroscopy; TNS, titanium with nanonetwork structures; TNS-MAP, titanium with nanonetwork structures coated with mussel adhesive protein.
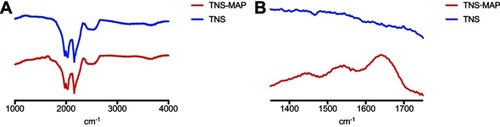
Figure 5 Cell adhesion, proliferation, and morphological analysis of rBMMSCs on sample disks.Notes: (A and B) TNS and TNS-MAP disks were incubated with rBMMSCs and cell adhesion and proliferation were evaluated after 15 mins, 30 mins, 1 day, 3 days and 7days, respectively, with a CellTiter-Blue® Cell Viability Assay (Promega, Madison, WI, USA), (C and D) TNS and TNS-MAP disks were incubated with rBMMSCs for 6 hrs, stained with phalloidin (F-actin) and DAPI (nuclei), and visualized by fluorescence microscopy; bar =100 μm. (***P<0.001; **P<0.01).
Abbreviations: rBMMSCs, rat bone marrow mesenchymal stem cells; TNS, titanium with nanonetwork structures; TNS-MAP, titanium with nanonetwork structures coated with mussel adhesive protein.
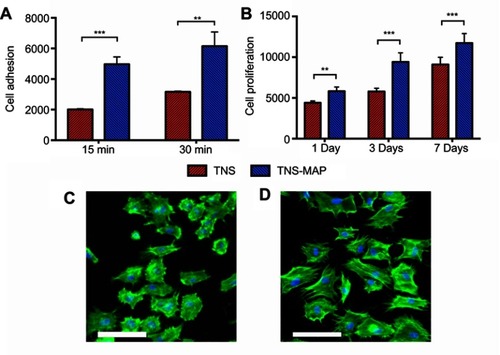
Figure 6 ALP activity and calcium deposition in cells grown on sample disks.Notes: rBMMSCs were cultivated on TNS and TNS-MAP disks for up to 28 days and the levels of (A) ALP activity (7 days and 14 days) and (B) calcium deposition (21 days and 28 days) were evaluated as described in the “Materials and Methods” (***P<0.001; **P<0.01; *P<0.05).
Abbreviations: ALP, alkaline phosphatase; rBMMSCs, rat bone marrow mesenchymal stem cells; TNS, titanium with nanonetwork structures; TNS-MAP, titanium with nanonetwork structures coated with mussel adhesive protein.
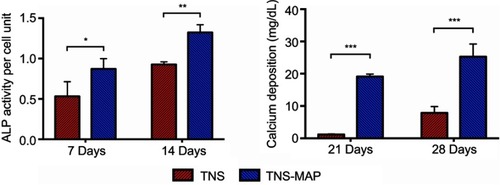
Figure 7 Expression of osteogenesis-related genes in cells grown on sample disks.Notes: (A–D): Expression levels of genes encoding Runx2, ALP, Bglap, and BMP-2 were evaluated in rBMMSCs cultivated on TNS and TNS-MAP disks at days 3 and 7 and days 14 and 21, respectively, by real-time RT-PCR (***P<0.001; **P<0.01; *P<0.05).
Abbreviations: Runx2, runt-related transcription factor 2; ALP, alkaline phosphatase; Bglap, bone γ-carboxyglutamate (gla) protein; BMP-2, bone morphogenetic protein 2; rBMMSCs, rat bone marrow mesenchymal stem cells; TNS, titanium with nanonetwork structures; TNS-MAP, titanium with nanonetwork structures coated with mussel adhesive protein.
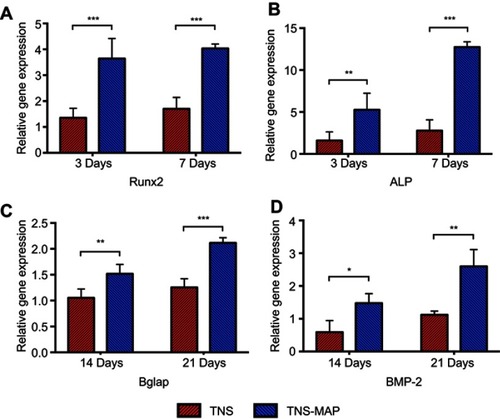
Figure 8 In vivo experimental operation.
Notes: (A) Incision and exposure of surgical area, (B) implantation model formation, (C) implant embedment, and (D) suture of surgical area; bar =1 cm.
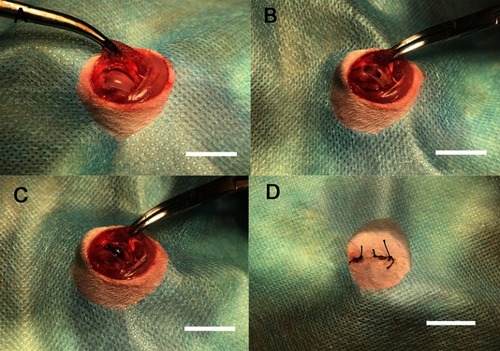
Figure 9 Transverse micro-CT reconstructed images of proximal tibiae showing ROI status.Notes: Implant (red), newly formed bone with relatively low density (kelly green), and cortical bone with high density (blue). (A) 8-week TNS group, and (B) 8-week TNS-MAP group; bar =2 mm.
Abbreviations: micro-CT, micro-computed tomography; TNS, titanium with nanonetwork structures; TNS-MAP, titanium with nanonetwork structures coated with mussel adhesive protein; ROI, region of interest.
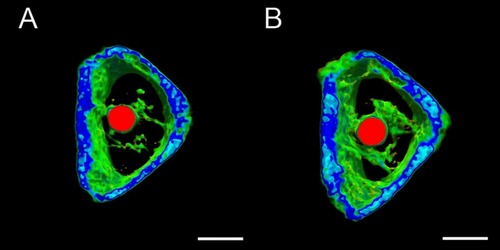
Figure 10 Micro-CT quantitative evaluation within the ROI.Notes: (A) Bone volume fraction of the two groups, (B) Tb.N of the two groups, (C) Tb.Th of the two groups, and (D) Tb.Sp of the two groups (***P<0.001; **P<0.01).
Abbreviations: micro-CT, micro-computed tomography; ROI, region of interest; BV/TV, bone volume/total volume; Tb.N, trabecular number; Tb.Th, trabecular thickness; Tb.Sp, trabecular separation; TNS, titanium with nanonetwork structures; TNS-MAP, titanium with nanonetwork structures coated with mussel adhesive protein.
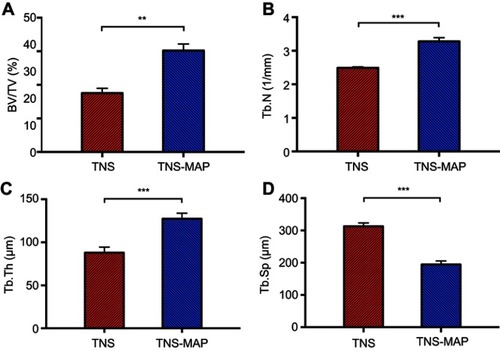
Figure 11 Histological sections with Villanueva staining showing bone tissue morphology around the implant (black).Notes: (A) TNS surface, and (B) TNS-MAP surface; bar =200 μm (***P<0.001; **P<0.01).
Abbreviations: TNS, titanium with nanonetwork structures; TNS-MAP, titanium with nanonetwork structures coated with mussel adhesive protein.
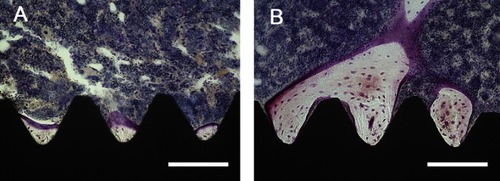
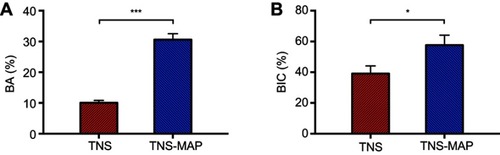
Figure 12 Quantitative histomorphometric analysis within the region of measurement (BA and BIC).Notes: (A) Percentage of new bone formation (BA) and (B) percentage of direct BIC (***P<0.001; *P<0.05).
Abbreviations: BA, bone area ratio; BIC, bone–implant contact; TNS, titanium with nanonetwork structures; TNS-MAP, titanium with nanonetwork structures coated with mussel adhesive protein.