Figures & data
Figure 1 Solubility of SCZ in different oils, surfactants and co-surfactants. Results are represented as the mean±SD (n=3).
Abbreviations: IPM, isopropyl myristate; MCT, medium chain triglycerides; OP-10, octaphenyl polyoxyethyiene-10; PEG400, polyethylene glycol 400.
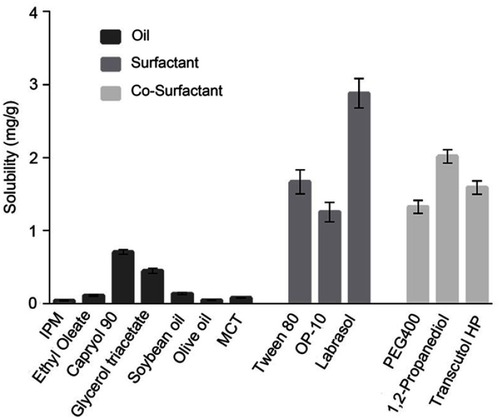
Figure 2 Pseudo-ternary phase diagrams of SCZ-NEs with different Km values (1:2, 1:1 and 2:1).
Abbreviations: SCZ-NEs, sulconazole-loaded nanoemulsions; Smix, mixed-surfactants; Km, surfactant: co-surfactant ratio.
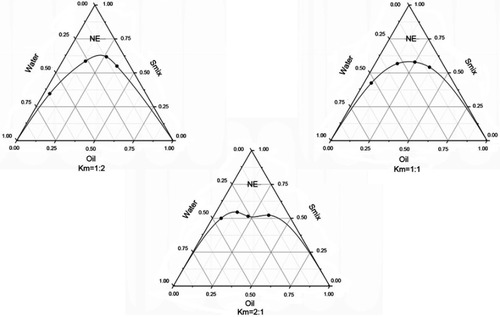
Table 1 Particle size, PDI and appearance stability of SCZ-NEs with different O:S ratios
Table 2 Particle size, PDI and appearance stability of SCZ-NEs with different proportions of aqueous phase
Table 3 Range of variables and their levels used in CCD
Table 4 Scheme of the central composite design: independent values, experimental values of the response variables and overall desirability (D)
Table 5 ANOVA of quadratic model for the EE%, DL%, particle size and zeta potential responses
Figure 3 3D surface map of the responses from the central composite design calculations. (A) The effects of X1 and X2 on EE%. (B) The effects of X1 and X2 on DL%. (C) The effects of X1 and X2 on particle size. (D) The effects of X1 and X2 on zeta potential.
Abbreviations: X1, oil/mixed-surfactant ratio; X2, proportion of the aqueous phase; EE, encapsulation efficiency (%); DL, drug loading (%)
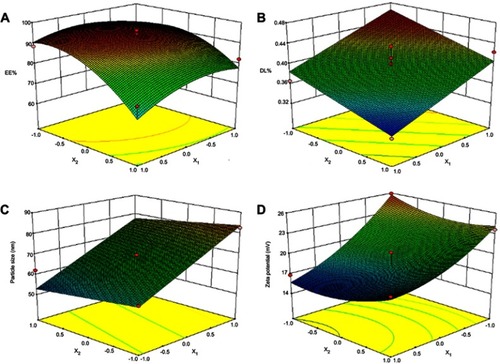
Figure 4 Particle size and morphology of the optimized SCZ-NE. (A) Particle size of the optimized SCZ-NE measured by DLS. (B) Morphology of the optimized SCZ-NE observed by TEM.
Abbreviations: SCZ-NEs, sulconazole-loaded nanoemulsions; DLS, dynamic light scattering; TEM, transmission electron microscopy.
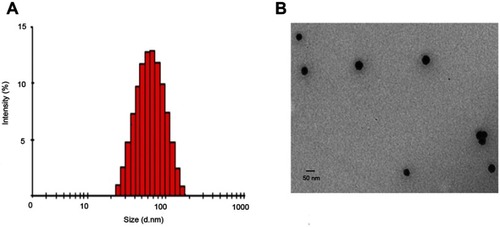
Table 6 The particle size, zeta potential, DL% and EE% of the SCZ-NE during 14 days of storage at room temperature
Table 7 The Js, Qn and Kp of SCZ-NE, MCZ cream and SCZ-DMSO solution after permeating for 12 hrs
Figure 5 Ex vivo permeation profiles of the SCZ-NE, MCZ cream and SCZ DMSO solution. Results are represented as the mean±SD (n=5).
Abbreviations: SCZ-NEs, sulconazole-loaded nanoemulsions; MCZ cream, miconazole commercial reference.
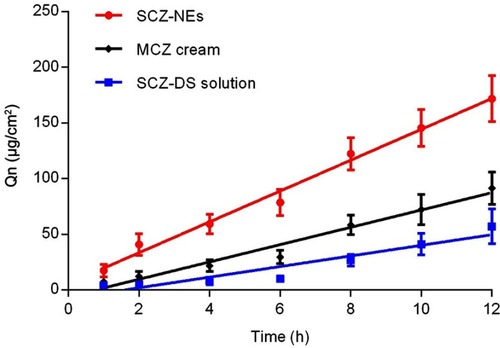
Table 8 ZOIs against C. albicans and T. rubrum for the SCZ-NEs, MCZ cream, SCZ-DMSO solution and Blank NEs after incubation at 30°C for 48 hrs
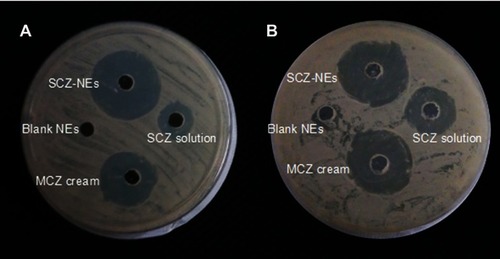
Figure 6 The zones of inhibition for the SCZ-NE, MCZ cream and SCZ DMSO solution. (A) The zones of inhibition for the SCZ-NE, MCZ cream and SCZ DMSO solution against C. albicans. (B) The zones of inhibition for the SCZ-NE, MCZ cream and SCZ DMSO solution against T. rubrum. The SCZ concentration in each formulation was 5 mg/ml. The results are represented as the mean±SD (n=3).
Abbreviations: SCZ-NEs, sulconazole-loaded in nanoemulsion; MCZ cream, miconazole commercial reference.