Figures & data

Figure 1 ee-As4S4 induced direct elimination of BCR-ABL in K562 cells. (A) The powder (insets) and solution of r-As4S4 and ee-As4S4 in ddH2O. (B) The size distribution of ee-As4S4 dissolved in ddH2O. (C) Cellular uptake of As4S4 in K562 cells incubated with 4.0 mg/L ee-As4S4 or r-As4S4. (D) The viability of K562 cells incubated with ee-As4S4 for 72 hrs. Data represent the mean ± SEM (n=4). **P<0.01, ***P<0.001 compared with the untreated group by Dunnett-T3 test. (E) The percentages of Annexin V- and PI-positive cells. Data represent the mean ± SEM (n=3). *P<0.05, **P<0.01 compared with untreated group by Dunnett-T3 test. (F) The expression of BCR-ABL in K562 cells incubated with imatinib and ee-As4S4 for 6 hrs. β-actin served as loading control. (G) Relative level of BCR-ABL mRNA in K562 cells incubated with ee-As4S4. Data represent the mean ± SEM (n=3). (H) The expression of c-CBL in K562 cells incubated with ee-As4S4 for 72 hrs. GAPDH served as loading control.
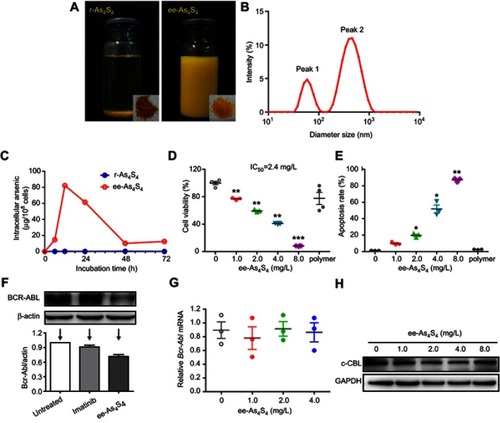
Figure 2 ee-As4S4 induced erythroid differentiation of CML cells through phosphorylation of p38 MAPK. (A) Representative benzidine staining images of K562 cells incubated with 0, 2.0 and 4.0 mg/L ee-As4S4, Bar represents 100 μm. (B) Quantification of benzidine-positive K562 cells according to the statistically counting. Data represent mean ± SEM (untreated group and 4.0 mg/L ee-As4S4 group, n=5; 2.0 mg/L ee-As4S4 group, n=3). **P<0.01 and ***P<0.001 compared with untreated group by Dunnett t-test. (C) Representative benzidine staining images of K562/AO2 cells incubated with or without ee-As4S4, Bar represents 100 μm. (D) The expression of CD235a for K562 cells incubated with ee-As4S4 for different time. (E) Phosphorylation of p38 MAPK in K562 cells incubated with ee-As4S4 for 72 h. (F) The expression of CD235a in K562 cells after incubation with ee-As4S4 together with SB202190. Data represent the mean ± SEM (n=3). ***P<0.001, by LSD post-hoc test.
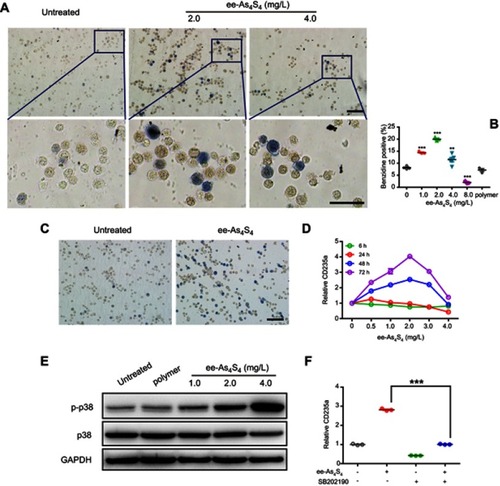
Figure 3 ee-As4S4 induced erythroid differentiation in BMMNCs derived from two CML patients. (A and C) Bone marrow examination images of the patients. (B and D) The percentage of CD235a+ cells of the CML patients before and after incubation with ee-As4S4.
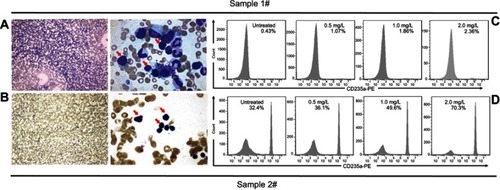
Figure 4 ee-As4S4 decreased BCR-ABL through autophagy. (A) TEM images of K562 cells incubated with ee-As4S4. The autophagosomes were pointed by red arrows.The scale bar represents 1 μm. (B) The expression of LC3B and BCR-ABL in K562 cells incubated with ee-As4S4 for 1 or 6 hrs. (C) Phosphorylation and total of AKT in K562 cells after incubation with ee-As4S4 for 72 hrs. GAPDH and β-ACTIN served as loading control.
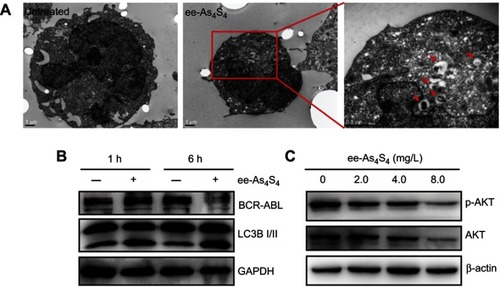
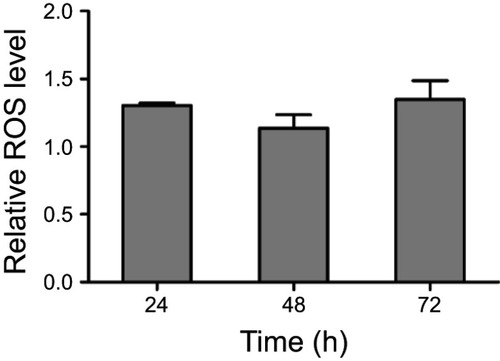
Figure 5 ee-As4S4 decreased intracellular ROS and HIF-1α in K562 cells. (A) Relative ROS level determined using 2ʹ, 7ʹ-dichlorodihydrofluorescein diacetate in K562 cells incubated with ee-As4S4. Data represent mean ± SEM (n=3). (B) ESR spectra of BMPO/·OOH adducts obtained from samples containing 25 mM BMPO, 20% DMSO, 2.5 mM KO2 and 0.35 mM 18-crown-6 in the absence or presence of 0.1mg/mL of As4S4. (C) The expression of HIF-1α incubated with ee-As4S4 for 6 and 12 hrs. GAPDH served as loading control.
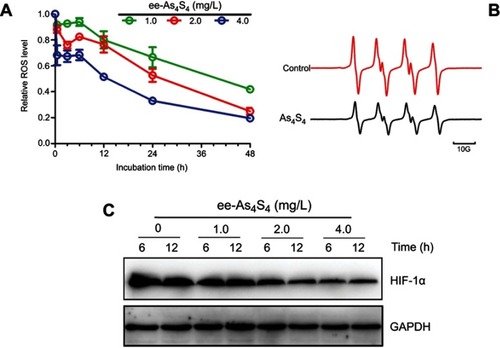
Figure 6 ee-As4S4 induced cell cycle arrest in G2/M phases through p-ERK1/2 dependent pathway. (A) Representative cell cycle analysis performed by flow cytometry of K562 cells incubated with ee-As4S4 at 1.0–4.0 mg/L for 72 hrs. (B) The percentage of cells in each phase. Data represent mean ± SEM (n=3) (C) The expression of cell cycle-dependent protein p21, GAPDH served as loading control. (D) The phosphorylation of ERK1/2 in K562 cells incubated with ee-As4S4. GAPDH served as loading control. (E) Cell viability of K562 cells treated with 4.0 mg/L of ee-As4S4, 5 μM of UO126 or both. (F) Representative cell cycle analysis of K562 cells incubated with 4.0 mg/L of ee-As4S4, 5 μM of UO126 or both.
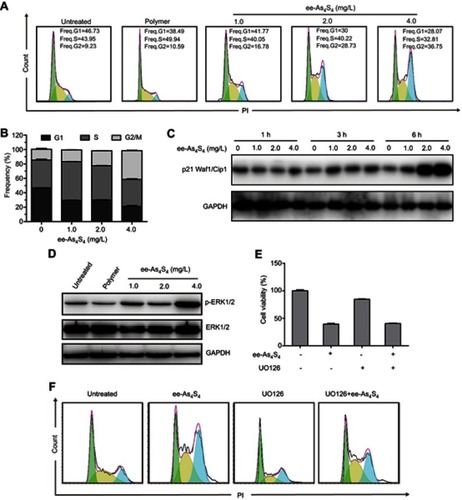
Figure S1 Cell viability of K562 cells after treatment with ee-As4S4 and imatinib for 6 hrs
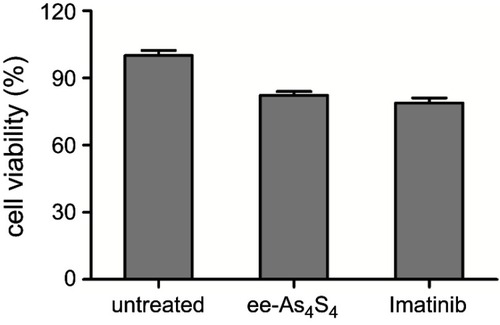
Figure S2 Representative benzidine staining images of K562 cells incubated with 300 mg/L soluplus. Bar represents 100 μm
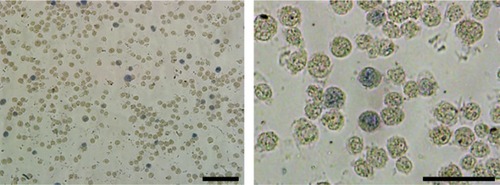
Figure S3 Overlapped distribution of CD235a expression of K562 cells after treatment with ee-As4S4 for 72 hrs in FACS
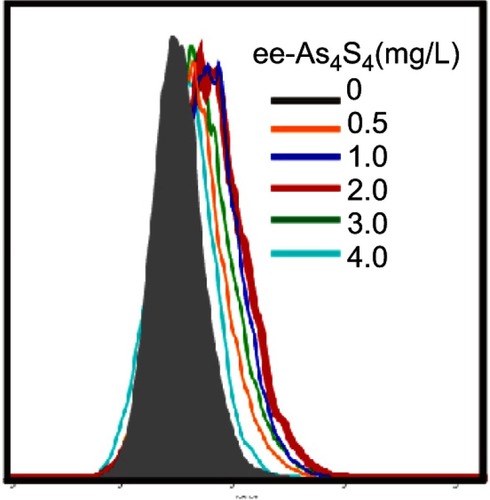
Figure S4 R-A4S4 did not induce any differentiation in K562 cells even when the concentration of As4S4 was up to 200 mg/L. Original magnification ×200
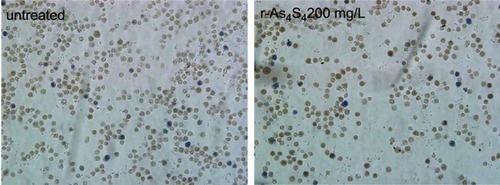
Figure S5 Hydrophilic polymer increased the ROS in K562 cells slightly