Figures & data
Figure 1 The preparation scheme for Nds-IR780 and the diagram of dual-mode molecule-targeted imaging and photothermal therapy for tumors.
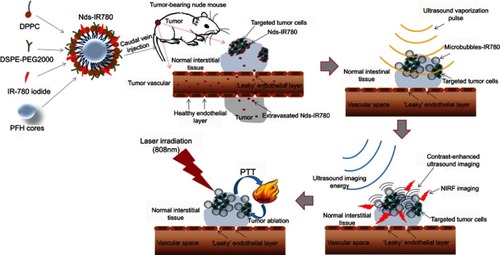
Figure 2 Exploration of the appropriate loading amount and biocompatibility of IR-780 iodide in Nds-IR780. (A) The standard curve of IR-780 iodide. (B) The signal intensity of Nds-IR780 with different amounts of IR-780 iodide added at 780 nm by HPLC. (C) The ER of IR-780 iodide in Nds-IR780 with different amounts added. *P<0.05 compared with the ER in the 50 μg added group. (D) The DL of IR-780 iodide in Nds-IR780 with different amounts added. #P<0.05 compared with the DL in the 50 μg added group. (E) The biocompatibility of IR-780 iodide in Nds-IR780. &P<0.05 compared with the cell viability of Nds-IR780 diluted 60 times.
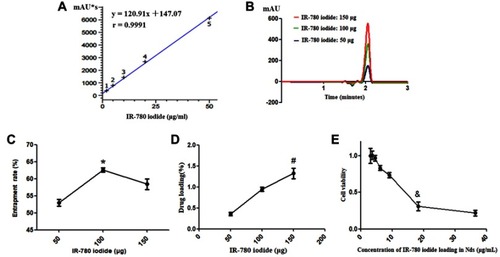
Figure 3 Characteristics of Nds-IR780. (A) Fabrication of Nds-IR780 observed by the naked eyes. (B) LSCM image of Nds-IR780 with an oil immersion objective lens (100×). (C) TEM image of Nds-IR780. (D) Number distribution of Nds-IR780ʹ size.
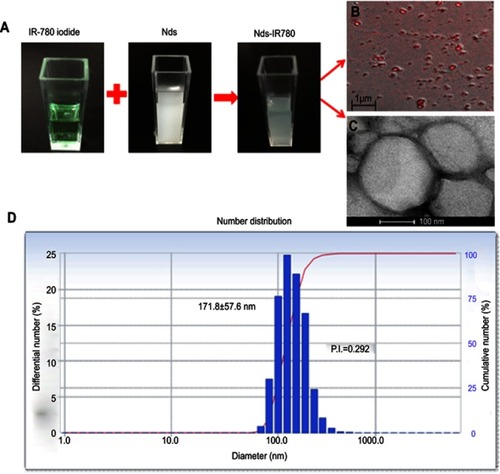
Figure 4 The stability observation of Nds-IR780 at 0 h, 24 h and 72 h.
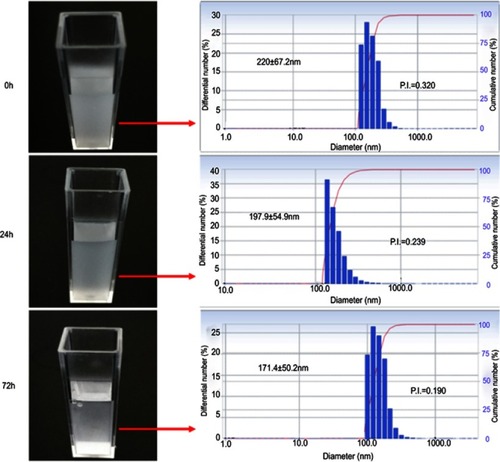
Figure 5 The dual-mode imaging and phase change ability of Nds-IR780. (A) NIRF imaging of Nds-IR780 (from wells 1 to 7: the Nds-IR780 concentration from high to low; well 8: 1×PBS as control). (B, D) Contrast-enhanced ultrasound imaging before and after Nds-IR780 phase transition in vitro. (C, E) Observation of Nds-IR780 phase transition by Optical Microscope. The blue arrows indicate microbubbles.
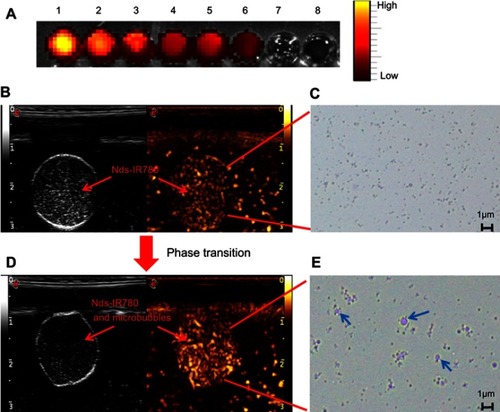
Figure 6 Tumor-targeting ability of Nds-IR780 was evaluated by co-incubation with SK-MEL-28 cells in vitro. (A) NIRF imaging and merged images of SK-MEL-28 cells incubated with Nds-IR780, IR-780 iodide and PBS. Magnification: 400×. The NIRF absorption quantity by SK-MEL-28 cells in Nds-IR780+cells (B), IR-780+cells (C) and PBS+cells (D) via FCM analysis.
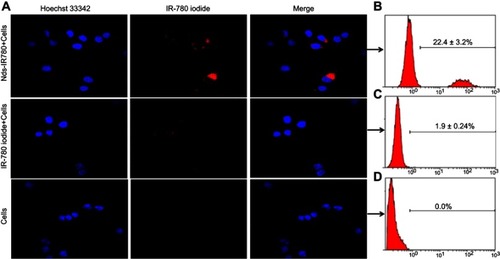
Figure 7 The in vivo tumor-targeted effect of Nds-IR780 at 6h and biodistribution of Nds-IR780 at 1 h, 8 h and 24 h evaluated by NIRF imaging via an IVIS Lumina II imaging station. The yellow dotted circles indicated the tumors.
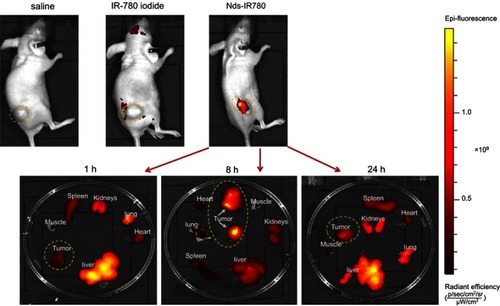
Figure 8 The detection of CMM by Nds-IR780 through dual-mode imaging in vivo. (A) A nude mouse bearing CMM. (B, C) Color Doppler flow imaging and contrast-enhanced ultrasound imaging after phase transition for CMM by Nds-IR780. (D) NIRF imaging of CMM with Nds-IR780. (E) NIRF imaging of SLNs with Nds-IR780. (F) Two-dimensional ultrasound imaging of SLNs.
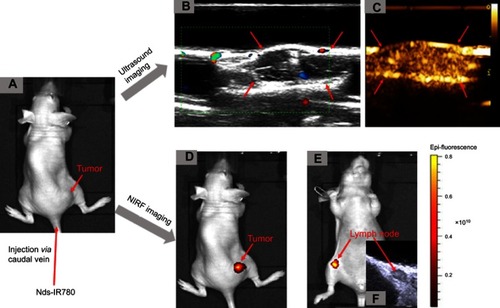
Figure 9 The photothermal treatment of CMM mediated by Nds-IR780 in vivo. (A) The photothermal treatment procedure for CMM by laser at 808 nm. (B) Tumor volume monitoring by two-dimensional ultrasound before and after treatment.
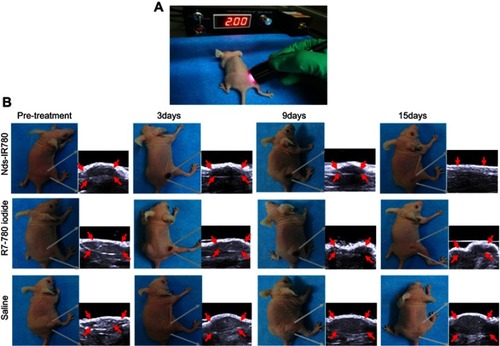
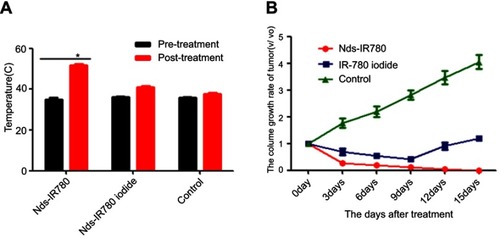
Figure 10 Temperature changes and tumor volume changes before and after treatment in different groups. (A) Temperature changes of tumor surface before and after treatment in the Nds-IR780, IR-780 iodide and control groups. *P<0.05, compared with the temperature before treatment in the Nds-IR780 group. (B) Comparison of tumor volume growth rate in the Nds-IR780 group, IR-780 group and control group during 15 days.