Figures & data
Figure 1 A schematic diagram of synthesis protocol of gold nanoparticles conjugation with indolicidin is shown. For conjugation of indolicidin with gold nanoparticles, thiol-stabilized gold nanoparticles were synthesized by adding 2-mercaptoethanol to provide hydroxyl groups. Then, cyanogen bromide used to activate hydroxyl groups on gold nanoparticles to create reactive cyanogen esters, which then attached to the primary amine of indolicidin by an isourea bond.
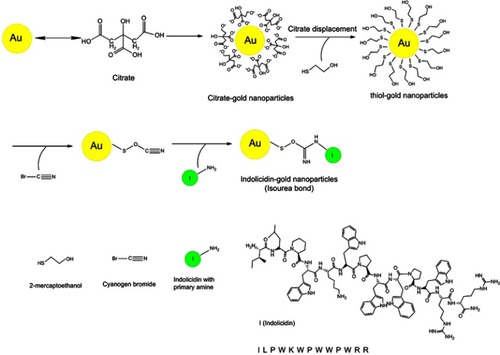
Table 1 Detailed information about the primers used in this study
Figure 2 Characterization of gold NPs and indolicidin-gold NPs conjugate. (A) UV-vis spectrum of gold NPs (I), thiol-capped gold NPs before sonication (II), thiol-capped gold NPs after sonication (III) and the gold NPs conjugated with indolicidin (IV). (B) The TEM image of colloidal gold NPs. (C) DLS graph of colloidal gold NPs with an average diameter of 32 nm (1) and the zeta potential of gold NPs (2), thiol-capped gold NPs (3) and indolicidin conjugated with gold NPs (4).
Abbreviations: NPs, nanoparticles; TEM, transmission electron microscopy; DLS, Dynamic light scattering.
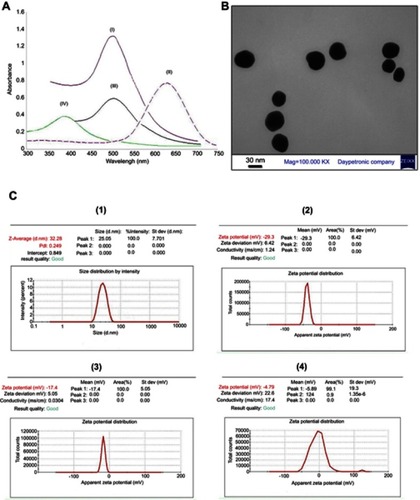
Figure 3 FTIR spectra. Representative fourier transformed infrared spectra of free indolicidin, bare gold NPs, thiol-capped gold NPs and indolicidin conjugated with gold NPs (gold NPs-I) are shown.
Abbreviations: FTIR, fourier-transform-infrared spectroscopy; I, indolicidin; NPs, nanoparticles; gold NPs-I, indolicidin-gold nanoparticles conjugates.
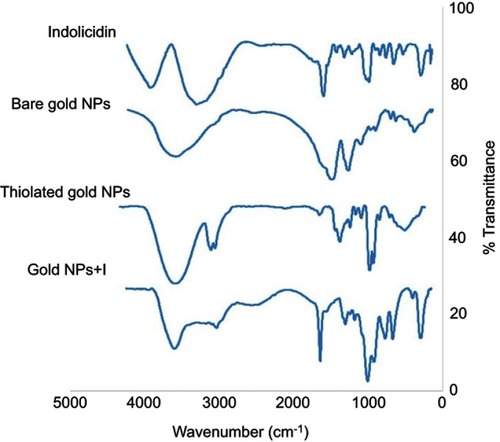
Table 2 The MIC and MFC of free indolicidin, bare gold nanoparticles, and indolicidin-gold nanoparticles conjugate against 10 isolates of Candida albicans. MIC was determined as the lowest concentration resulting in at least 50% reduction of growth compared to the control
Figure 4 Evaluation cytotoxicity effects of the bare gold NPs, indolicidin-gold NPs, free indolicidin and fluconazole on NIH3T3 cell line after 48 hrs treatments. Dose-dependent effects of free indolicidin in comparison to the indolicidin-gold NPs conjugates in different concentrations (A), bare gold NPs (B) and fluconazole (C) on the viability of NIH3T3 cells are shown. Each data point represents the mean±SD of three replicates.
Abbreviation: NPs, nanoparticles.
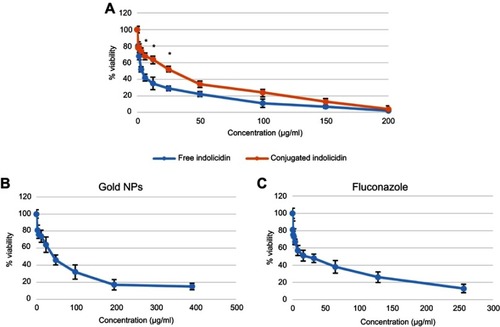
Figure 5 Expression analysis of the ERG11 gene in Candida albicans isolates exposed to the bare gold NPs, indolicidin-gold NPs, free indolicidin, and fluconazole after 24 hrs of cultivation. The relative expression of the 14α-demethylase (ERG11) gene relative to that of the internal control ACT1 gene in 10 C. albicans isolates obtained from the burn patients suffering from candidiasis and the control strain ATCC 1023 in comparison to the non-treated group is shown. The data are presented as mean±SD, calculated from three independent experiments (*P<0.05).
Abbreviations: NPs, nanoparticles; gold NPs-I, indolicidin-gold nanoparticles conjugates; C1-C10, C. albicans strains isolated from burn patients suffering from candidiasis; CR, C. albicans ATCC strain 1023.
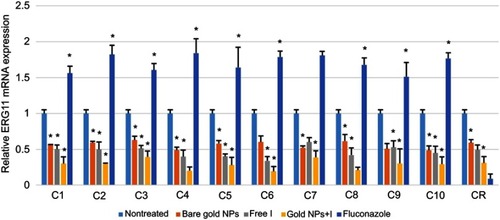
Figure 6 Evaluation of the hemolytic activity. The hemolytic activity of free indolicidin, conjugated indolicidin, bare gold NPs, and fluconazole were determined using human erythrocytes. Hemolytic activity of free indolicidin and indolicidin conjugated with gold NPs (A), bare gold NPs (B) and fluconazole (C) were measured in comparison with Triton X-100 treated erythrocytes as control cells. Data presented are the means of three independent experiments±SD.
Abbreviation: NPs, nanoparticles.
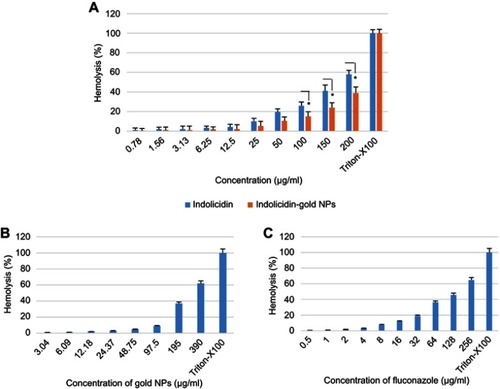
Figure 7 Quantitative RT-PCR analysis of the iNOS gene in murine macrophages incubated with the Candida albicans after 24 hrs treatment with bare gold NPs, free indolicidin, indolicidin conjugated with gold NPs, and fluconazole. The relative levels of gene expression are presented as fold changes in the treated groups with respect to the nontreated control. The gene transcript level was normalized against the GAPDH gene expression. Statistically significant differences between the C. albicans-treated group and the nontreated group, and between the C. albicans-treated group and the other treated groups (*P<0.05). The data shows mean±SD of three independent experiments.
Abbreviations: I, indolicidin; NPs, nanoparticles; gold NPs-I, indolicidin-gold nanoparticles conjugates.
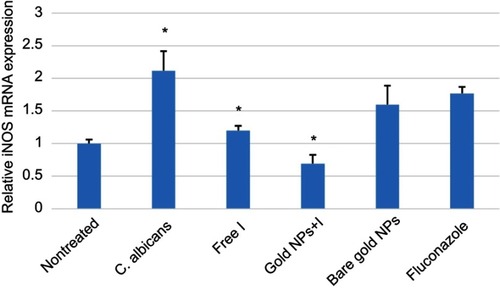
Figure S1 Size distribution by density of thiol-capped gold nanoparticles (NPs) and indolicidin-gold NPs conjugates is shown. The average size of thiol-capped gold nanoparticles was about 40 nm (A) and the average size of indolicidin conjugated with gold NPs was about 193 nm (B)
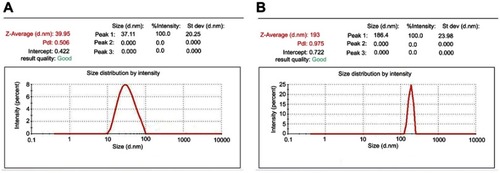
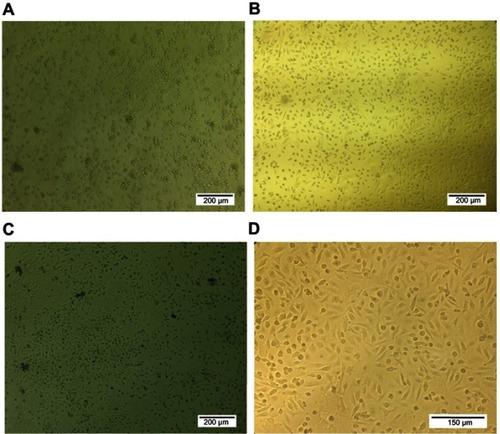
Figure S2 Morphological assessment of macrophages isolated from mice peritoneal cavity. Microscopy images of macrophages phenotype on day 2 (A), day 7 (B), and day 14 with 10× magnification (C), and day 14 with 20× magnification (D)