
Figures & data
Figure 1 Synthesis and characterization of DSPE-PEG2000-Mannose. (A) Schematic of synthetic DSPE-PEG2000-Mannose. (B) The 1H-NMR spectrum of DSPE-PEG2000. (C) The 1H-NMR spectrum of DSPE-PEG2000-Mannose.
Note: a, 1.0–1.5 ppm (DSPE); b, 3.5–4.0 ppm (PEG); c, 6.9–7.5 ppm (phenyl group)
Abbreviation: 1H-NMR, 1H-Nuclear Magnetic Resonance.
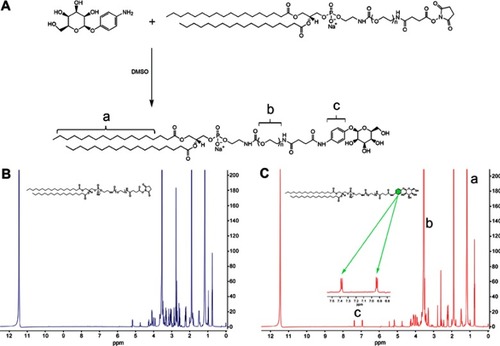
Figure 2 Particle size distribution and morphology of Lipo, PEG-Lipo, and Man-PEG-Lipo. Scale bar =100 nm.
Abbreviations: Lipo, liposomes; PEG-Lipo, PEGylated liposomes; Man-PEG-Lipo, mannosylated liposomes.
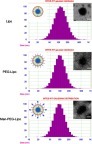
Figure 3 In vitro release profile of liposomes in PBS (pH 7.4) containing 0.5% (w/v) Tween 80. Each value represents the mean ± SD (n=3).
Abbreviations: Lipo, liposomes; PEG-Lipo, PEGylated liposomes; Man-PEG-Lipo, mannosylated liposomes; PBS, phosphate buffered saline.
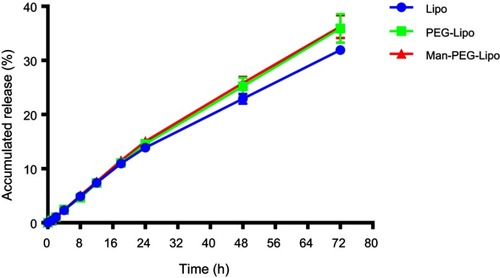
Figure 4 In vitro cytotoxicity of liposomes in RAW264.7 cells at 24 h. Each value represents the mean ± SD (n=6).
Abbreviations: Lipo, liposomes; PEG-Lipo, PEGylated liposomes; Man-PEG-Lipo, mannosylated liposomes.
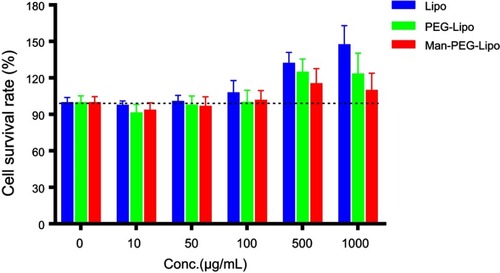
Figure 5 In vitro cellular uptake of coumarin-6-loaded liposomes in RAW264.7 cells or IL-4-conditioned RAW264.7 cells. (A) CLSM images of cellular uptake. (B and C) Mean fluorescence intensity was determined by flow cytometry. Scale bar =20 µm. Each value represents the mean ± SD (n=3). **p<0.01 and ***p<0.001.
Abbreviations: Lipo, liposomes; PEG-Lipo, PEGylated liposomes; Man-PEG-Lipo, mannosylated liposomes; IL-4, Interleukin-4; CLSM, confocal laser scanning microscopy.
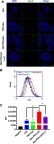
Figure 6 3D co-cultured multicellular tumor spheroids penetration. (A) The culture and penetration experiment procedure of 3D co-cultured multicellular tumor spheroids. (B) Images of 3D co-culture multicellular tumor spheroids by SEM and CLSM. RAW264.7 cells were labeled with DiI. Scale bar =100 µm. (C) Penetration of coumarin-6-loaded liposomes in 3D co-cultured multicellular tumor spheroids. Scale bar =500 µm.
Abbreviations: Lipo, liposomes; PEG-Lipo, PEGylated liposomes; Man-PEG-Lipo, mannosylated liposomes; 3D, three-dimensional; SEM, scanning electron microscope; CLSM, confocal laser scanning microscopy.
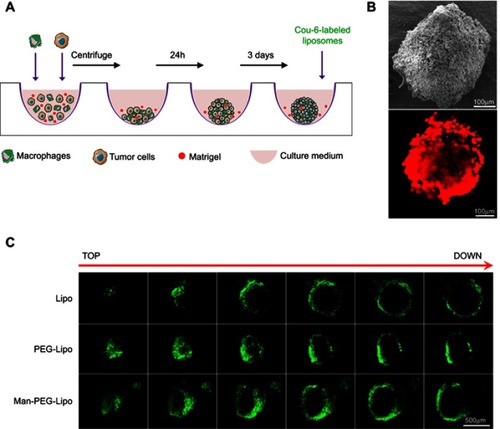
Figure 7 Cellular internalization pathway and intracellular trafficking of Man-PEG-Lipo. (A) Effects of endocytosis inhibitors on the cellular uptake of Man-PEG-Lipo. (B) Intracellular trafficking of Man-PEG-Lipo. Scale bar =20 µm. Each value represents the mean ± SD (n=3). ***p<0.001 compared with the control group.
Abbreviation: Man-PEG-Lipo, mannosylated liposomes.
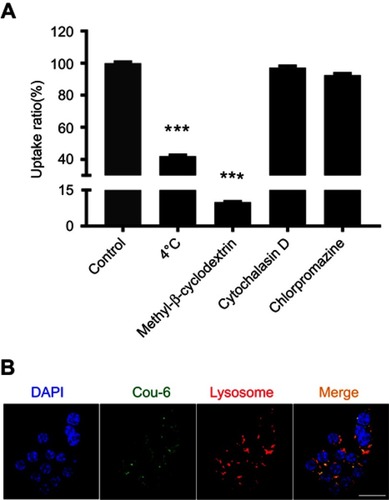
Figure 8 In vivo biodistribution of DiR-loaded liposomes. (A) In vivo fluorescence images of BALB/c mice bearing 4T1 after tail vein injection of DiR-loaded liposomes. (B) Ex vivo fluorescence images of excised organs and tumors at 24 h post-injection of DiR-loaded liposomes. (C) 3D reconstruction of in vivo imaging of DiR-Man-PEG-Lipo-treated mice.
Abbreviations: Lipo, liposomes; PEG-Lipo, PEGylated liposomes; DiR, 1,1-dioctadecyl-3,3,3,3-tetramethylindotricarbocyanine iodide; 3D, three-dimensional; Man-PEG-Lipo, mannosylated liposomes.
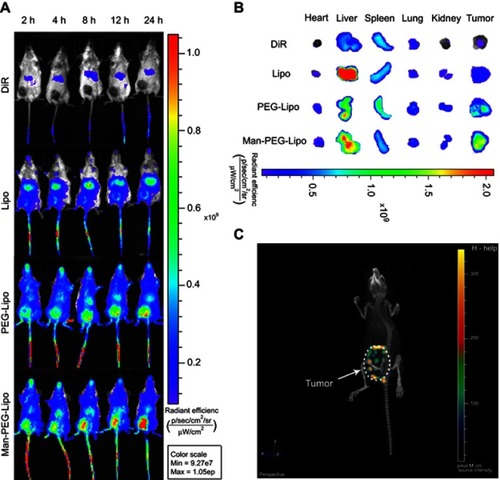
Figure 9 Receptor expression ratio of RAW264.7 cells (M0 macrophages) or IL-4-conditioned RAW264.7 cells (M2 macrophages) after incubation with liposomes for 24 h. (A) M0 macrophages were treated with IL-4 for 24 h. (B) M0 macrophages were treated with liposomes for 24 h. (C) M2 macrophages were treated with liposomes for 24 h. Each value represents the mean ± SD (n=3). *p<0.05, **p<0.01, and ***p<0.001 compared with the control group.
Abbreviations: Lipo, liposomes; PEG-Lipo, PEGylated liposomes; Man-PEG-Lipo, mannosylated liposomes; IL-4, Interleukin-4.
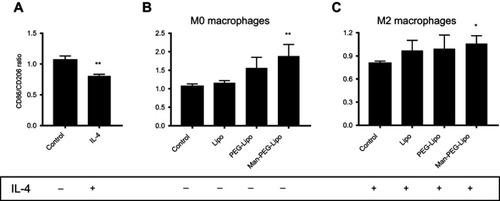
Figure 10 In vivo antitumor efficacy and safety evaluation of liposomes. (A) The schematic of treatment schedule. The images of excised tumors (B), body weight changes (C), tumor weight (D), and tumor growth inhibition ratio (TGI%) (E) of murine G422 glioma tumor-bearing mice after the intravenous treatment of liposomes. Each value represents the mean ± SD (n=7). *p<0.05, **p<0.01, and ***p<0.001 compared with the vehicle group.
Abbreviations: Lipo, liposomes; PEG-Lipo, PEGylated liposomes; Man-PEG-Lipo, mannosylated liposomes; TGI%, tumor growth inhibition ratio.
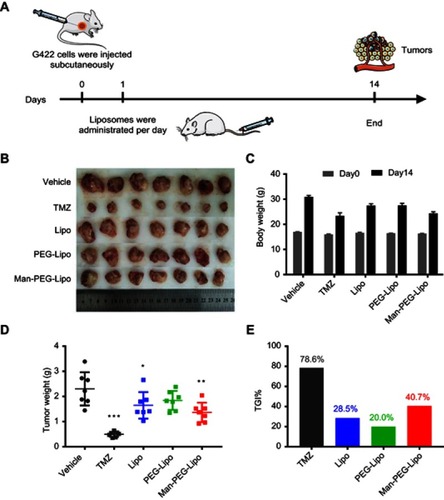
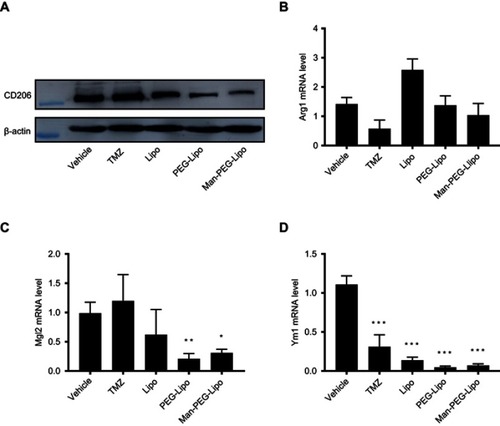
Figure 11 Man-PEG-Lipo promotes the polarization of TAMs. Murine G422 glioma tumor-bearing mice were treated with liposomes, and the tumors were analyzed by western blot for CD206 expression (A), and quantitative real-time PCR for Arg1 (B), Mgl2 (C), and Ym1 (D) mRNA expression. Each value represents the mean ± SD (n=3). *p<0.05, **p<0.01, and ***p<0.001 compared with the vehicle group.
Abbreviations: Lipo, liposomes; PEG-Lipo, PEGylated liposomes; Man-PEG-Lipo, mannosylated liposomes; TAMs, tumor-associated macrophages; CD206, cluster of differentiation 206; Arg1, Arginase 1; Mgl2, Macrophage galactose-type C-type lectin 2; Ym1, Chitinase 3-like 3.
Scheme 1 The schematic diagram of Man-PEG-Lipo resetting TAMs.
Abbreviations: Man-PEG-Lipo, mannosylated liposomes; TAMs, tumor-associated macrophages.
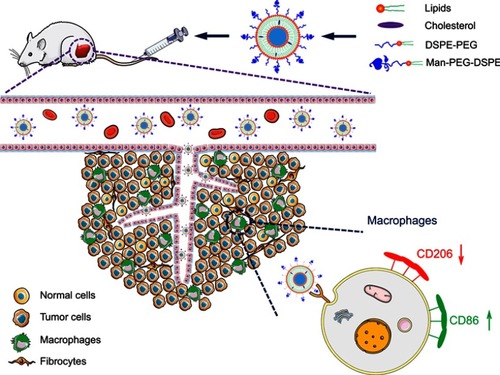
Figure S1 Ex vivo average radiant efficiency of excised tissues and tumors at 24 h post-injection. The average radiant efficiency (A) and tumor-to-tissue ratios (B) measured from the fluorescence images of excised tissues and tumors.
Abbreviations: PEG-Lipo, PEGylated liposomes; Man-PEG-Lipo, mannosylated liposomes.
