
Figures & data
Table 1 Hemolysis Experiment Group Design
Figure 1 The appearance of the precursor injection before and after the formation of the in situ liquid crystal gel.
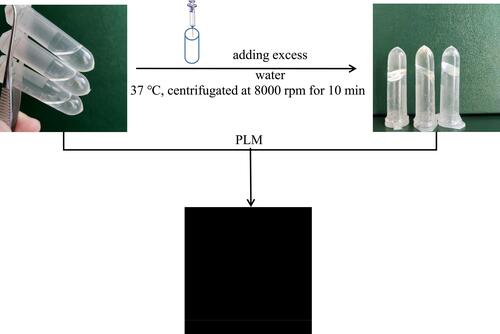
Figure 2 Hemolysis testing: (A) appearance of each group of samples in RCBs solution; (B) RCBs morphology in each group; (C) determination of the λmax; (D) hemolysis rate (means ± SD, n = 3; *p<0.05, **p<0.01).
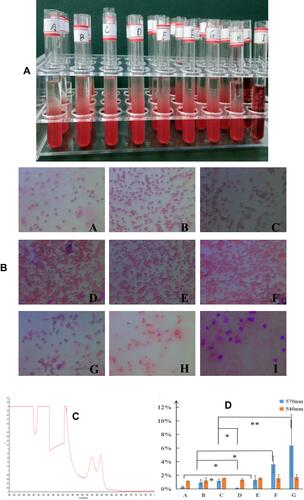
Figure 3 The results of histocompatibility test: (A) appearance after subcutaneous injection for 5 min; (B) liquid crystal gel state after subcutaneous injection for 15 min; (C) HE staining results of tissue surrounding the liquid crystal gels after subcutaneous injection of the precursor injection into SD rats at the indicated number of days (scale bar: 1:100).
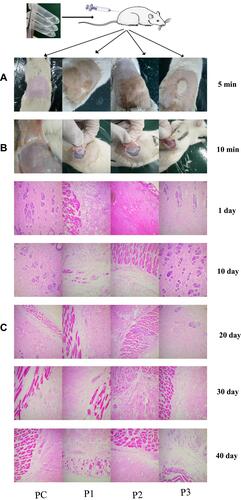
Table 2 The Results of Histocompatibility Experiment
Figure 4 Cytotoxicity of the blank precursor injections and PYT (means ± SD, n = 3).
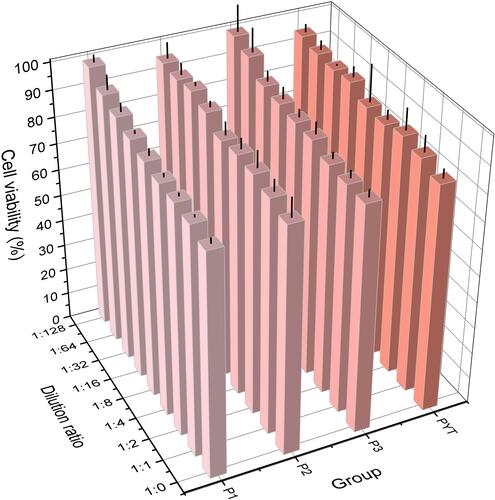
Figure 5 The results of in vitro anticancer activity at different time and dilution ratios: (A) SN and/or 5-FU solution; (B) drug-loaded P1; (C) drug-loaded P2; (D) drug-loaded P3 (means ± SD, n = 3; at the same incubation time of the same prescription: SN or 5-FU VS SN+5-FU, *p<0.05, **p<0.01).
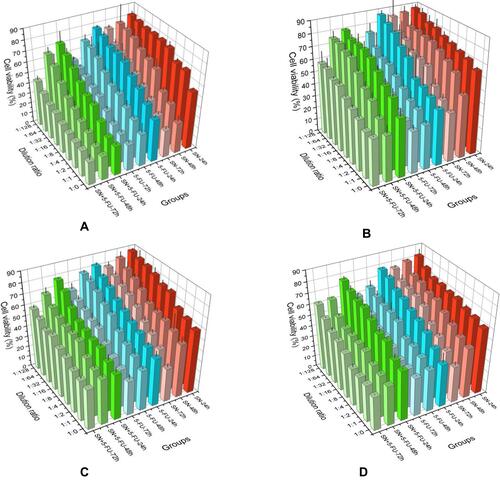
Table 3 The Results of Hep G2 Cells Treated by Various Different Dilution Ratios of SN and/Or 5-FU Solution by CalcuSyn 2.1 Software (Including CI, r, Dm, M; Compared with the Combined Group of the Same Culture Time, *p<0.05, **p<0.01)
Figure 6 Median-effect plot, dose-effect curve and algebraic estimate generated by CalcuSyn 2.1 software for Hep G2 cells treated by various different dilution ratios of SN and/or 5-FU solution at (A) 24h, (B) 48h and (C) 72h.
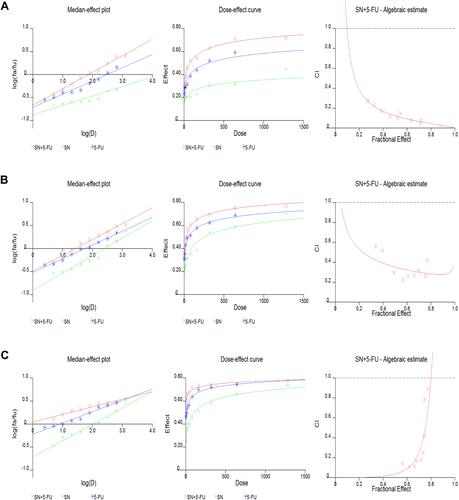
Figure 7 The results of in vitro drug release of SN (A) and 5-FU (B).
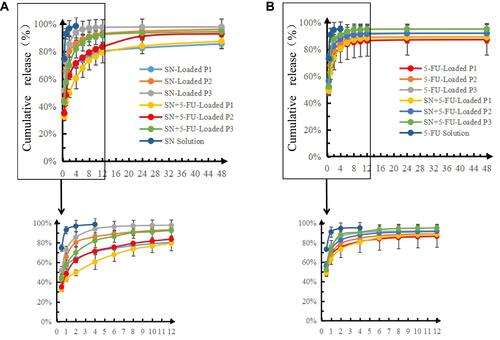
Table 4 r Values of Release Curves Fitted by Different Equations