
Figures & data
Figure 1 Preparation and characterization of designed miRNA and functional miRNA liposomes. A. Mass spectrum of DSPE-PEG2000-MAL. (B) Mass spectrum of tLyp-1. (C) Mass spectrum of DSPE-PEG2000-tLyp-1. The results demonstrate that DSPE-PEG2000-tLyp-1 is successfully synthesized. (D) The sense sequences of designed miRNA and meaningless miRNA (miRNA negative control, miRNA-NC). (E) Particle sizes of miRNA complexes in different mass ratios of (miRNA + ctDNA)/protamine in the range of 0.8–2.1. Data are presented as mean ± standard deviation (n=3). (F) Zeta potentials of miRNA complexes in different mass ratios of (miRNA + ctDNA)/protamine in the range of 0.8 −2.1. Data are presented as mean ± standard deviation (n=3). The results indicate that the complex at a mass ratio of 1.8 exhibits a stable status in viewing the suitable particle size and Zeta potential. (G) Particle sizes distributions of different formulations: 1, blank functional liposomes; 2, regular vinorelbine liposomes; 3, miRNA complexes; 4, functional vinorelbine liposomes; 5, functional miRNA liposomes. (H) Images of functional miRNA liposomes by TEM. (I) Images of functional vinorelbine liposomes by TEM.
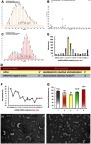
Figure 2 Cellular uptake and co-localization of functional miRNA liposomes in TNBC cells. (A). Cellular uptake in MDA-MB-231 cells after treatments. a, blank control; b, FAM labeled free miRNA complexes; c, FAM labeled regular miRNA liposomes; d, FAM labeled functional miRNA liposomes. The results indicate that the FAM labeled functional miRNA liposomes significantly enhance the cellular uptake by MDA-MB-231 cells. (B) Fluorescence intensity values in MDA-MB-231 cells after treatments. a, blank control; b, FAM labeled free miRNA complexes; c, FAM labeled regular miRNA liposomes; d, FAM labeled functional miRNA liposomes. **P<0.01. The results reveal that the FAM labeled functional miRNA liposomes exhibit the strongest cellular uptake by MDA-MB-231 cells. (C) Co-localization in MDA-MB-231 cell mitochondria after treatments. a, blank control; b, FAM labeled free miRNA complexes; c, FAM labeled regular miRNA liposomes; d, FAM labeled functional miRNA liposomes. The results show that only FAM-labelled functional miRNA liposomes were effectively co-localized in cytoplasm and partially in mitochondria.
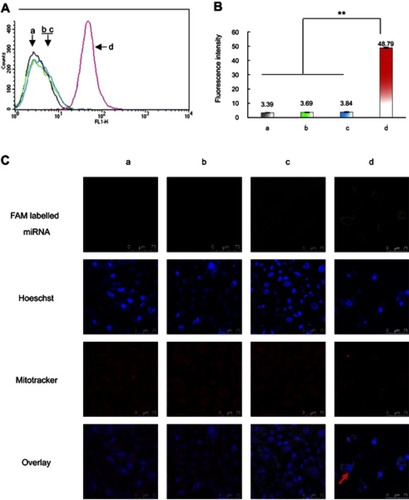
Figure S1 Cellular uptake and co-localization of functional coumarin liposomes in TNBC cells. (A) Cellular uptake in MDA-MB-231 cells after treatments. a, blank control; b, free coumarin complexes; c, regular coumarin liposomes; d, functional coumarin liposomes. The results indicate that the functional coumarin liposomes are higher internalized than regular coumarin liposomes but less than free coumarin. (B) Fluorescence intensity values in MDA-MB-231 cells after treatments. a, blank control; b, free coumarin complexes; c, regular coumarin liposomes; d, functional coumarin liposomes. **P<0.01. The results show that the functional coumarin liposomes exhibit 2.6-folded cellular uptake than regular coumarin liposomes. (C) Co-localization in MDA-MB-231 cell mitochondria after treatments. a, blank control; b, free coumarin complexes; c, regular coumarin liposomes; d, functional coumarin liposomes. The results show that the functional coumarin liposomes are significantly higher co-localized than regular coumarin liposomes in cytoplasm and in mitochondria.
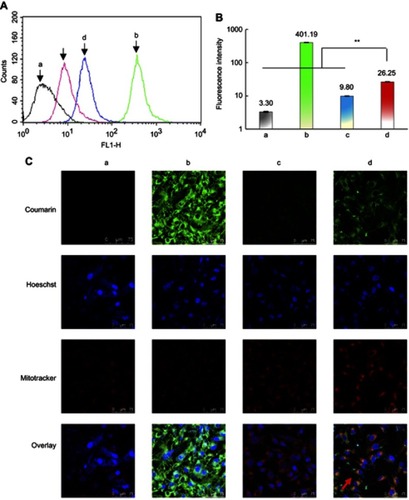
Figure 3 Functional miRNA liposomes enabling to silence Slug gene and suppressing TGF-β1-Smad signaling pathway in TNBC cells. (A) The relative mRNA levels of transcription factor Slug, Snail, Blimp-1, and BMP5 in MDA-MB-231 cells after transfection of functional miRNA-NC liposomes and functional miRNA liposomes. The results indicate that functional miRNA liposomes are able to silence Slug and Blimp-1 and to up-regulate BMP5. (B) The protein expressions of Slug, Snail, Blimp-1, and BMP5 after transfections. a, functional miR-NC liposomes; b, functional miRNA liposomes; c, functional miRNA liposomes with TGF-β1/Smad inhibitor; d, functional miRNA liposomes with NF-κB inhibitor. The results show that the functional miRNA liposomes significantly increase BMP5 protein level while reducing Slug and Blimp-1 proteins. Besides, functional miRNA liposomes do not affect the Snail protein level. In contrast, the silencing effect of functional miRNA liposomes on Slug protein is evidently inhibited by TGF-β inhibitor, and the changed BMP5 and Blimp-1 protein levels are recovered to those of negative control. (C) Smad2/3/4 protein complex in MDA-MB-231 cells. 1, input: positive control, lysates of MDA-MB-231 cells; 2, mouse IgG: negative control; 3, protein samples after immunomagnetic bead sorting by Smad2/3 ChIP grade antibodies. a, functional miR-NC liposomes; b, functional miRNA liposomes; c, functional miRNA liposomes with TGF-β1/Smad inhibitor; d, functional miRNA liposomes with NF-κB inhibitor. The results show that Smad2/3/4 complexes exist in un-treated MDA-MB-231 cells while functional miRNA liposomes inhibit the formation of Smad2/3/4 complex. TGF-β inhibitor and NF-κB inhibitor relieve the inhibition caused by functional miRNA liposomes through a phosphorylation of Smad protein. The results demonstrate that the functional miRNA liposomes are able to silence Slug gene and to inhibit TGF-β1/Smad pathway. (D) Illustration for action mechanism of miRNA.
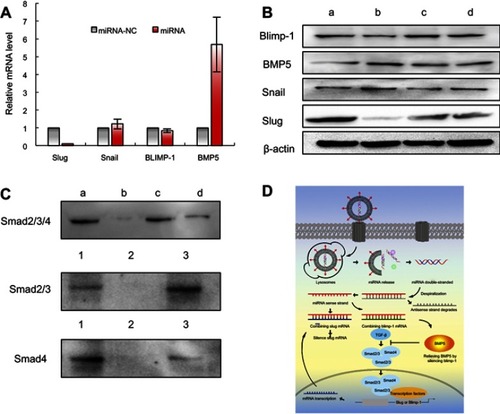
Figure 4 Functional miRNA liposomes inhibiting invasion and migration of TNBC cells. (A) The cell invasion of MDA-MB-231 cells after treatments. 1, blank control; 2, functional miRNA liposomes; 3, functional miRNA liposomes with TGF-β1/Smad inhibitor; 4, functional vinorelbine liposomes; 5, functional miRNA liposomes with functional vinorelbine; 6, counted invasion cell numbers of 9 visual fields, **P<0.01. The red arrows indicate the invading cells transfected with functional miRNA liposomes are significantly reduced compared with blank control group. The results demonstrate that both functional miRNA liposomes and functional vinorelbine liposomes enable to inhibit cell invasion, and the combination treatment using functional miRNA liposomes with functional vinorelbine liposomes exhibit the strongest inhibitory effect. (B) The cell migration of MDA-MB-231 cells after treatments. 1, blank control; 2, functional miRNA liposomes; 3, functional miRNA liposomes with TGF-β1/Smad inhibitor; 4, functional vinorelbine liposomes; 5, functional miRNA liposomes with functional vinorelbine; 6, counted migration cell numbers of 9 visual fields, **P<0.01. The red arrows indicate the migrating cells transfected with functional miRNA liposomes are significantly reduced compared with blank control group. The results demonstrate that both functional miRNA liposomes and functional vinorelbine liposomes enable to inhibit cell migration, and the combination treatment using functional miRNA liposomes with functional vinorelbine liposomes exhibit the strongest inhibitory effect.
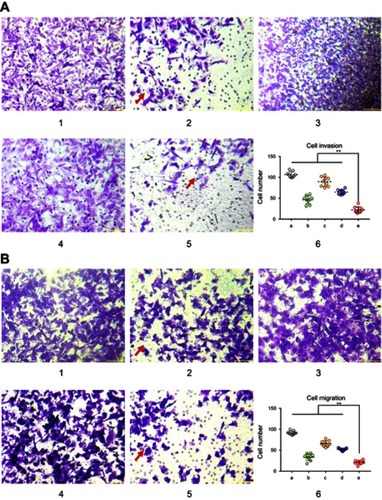
Figure 5 Cytotoxicity and apoptosis in TNBC cells after treatment with functional miRNA liposomes and functional vinorelbine liposomes. (A) Cytotoxicity in MDA-MB-231 cells in vitro after treatments. The results reveal that the combination treatment of functional miRNA liposomes and functional vinorelbine liposomes has the strongest efficacy in killing MDA-MB-231 cells. (B) Cytotoxicity in MDA-MB-231 cells in vitro after transfections. The results demonstrate that the concentration of 100 nM miRNA is the optimal transfection concentration, with the highest transfection efficiency and lower cytotoxicity. (C) Early apoptosis and late apoptosis ratios in MDA-MB-231 cells after treatments at 12 hrs. Data are the mean ± standard deviation (n=3). a, blank control; b, regular vinorelbine liposomes; c, functional vinorelbine liposomes; d, functional miRNA liposomes; e, functional miRNA liposomes with functional vinorelbine liposomes. (D) Total apoptosis ratios in MDA-MB-231 cells after treatments at 12 hrs. Data are the mean ± standard deviation (n=3). a, blank control; b, regular vinorelbine liposomes; c, functional vinorelbine liposomes; d, functional miRNA liposomes; e, functional vinorelbine liposomes with functional miRNA liposomes. The results indicate that the combination treatment of functional miRNA liposomes and functional vinorelbine liposomes result in the strongest apoptosis in MDA-MB-231 cells.
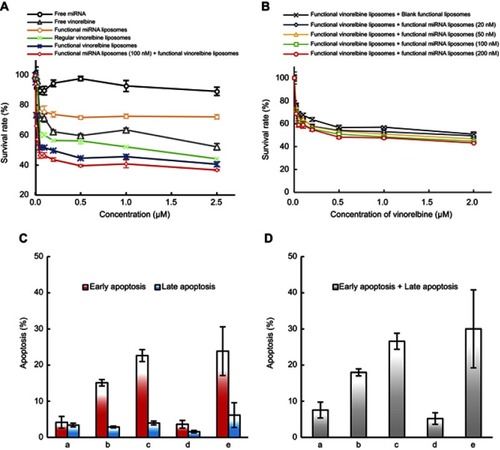
Figure 6 Anticancer efficacy and silencing Slug gene of functional miRNA liposomes in TNBC cancer-bearing mice. (A) Anticancer efficacy in cancer-bearing nude mice. P<0.05; a, vs physiological saline; b, vs functional miRNA liposomes; c, vs functional vinorelbine liposomes. Data are presented as mean ± standard deviation (n=6). (B) Body weight changes in cancer-bearing nude mice, Data are presented as mean ± standard deviation (n=6). (C) Apoptosis in the tumor tissues of breast cancer-bearing nude mice. a, physiological saline; b, functional miRNA liposomes; c, functional vinorelbine liposomes; d, functional miRNA liposomes with functional vinorelbine liposomes. The number of red arrows indicate the level of cell apoptosis rate. (D) IHC staining of Slug, Snail, Blimp-1, and BMP5 in tumor tissue. a, physiological saline; b, functional miRNA liposomes; c, functional vinorelbine liposomes; d, functional miRNA liposomes with functional vinorelbine liposomes. Light blue indicates no protein expression, light yellow indicates lower protein expression, brown-yellow color indicates middle expression, and dark brown indicates higher protein expression. The red up-arrow indicates the increase of protein expression while the number of red down-arrow indicates the decrease of the protein expression. The results demonstrate that the functional miRNA liposomes have a stronger anticancer effect than functional vinorelbine liposomes, and the combination treatment of functional miRNA liposomes with functional vinorelbine liposomes result in nearly a full inhibition to the growth of tumor. Furthermore, functional miRNA liposomes significantly silence the Slug and Blimp-1 proteins while increase BMP5 protein in tumor tissue.
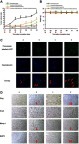
Figure S2 HE staining of organs tissues (heart, liver, spleen, lung, and kidney) in TNBC cancer-bearing mice. (a) Physiological saline; (b) Functional miRNA liposomes; (c) Functional vinorelbine liposomes; (d) Functional vinorelbine liposomes plus functional miRNA liposomes. The results reveal that, after treatments, heart, liver, spleen, lung, and kidney tissues in the cancer-bearing rats have no obvious histopathological abnormalities or lesions as compared with those in the healthy rats.
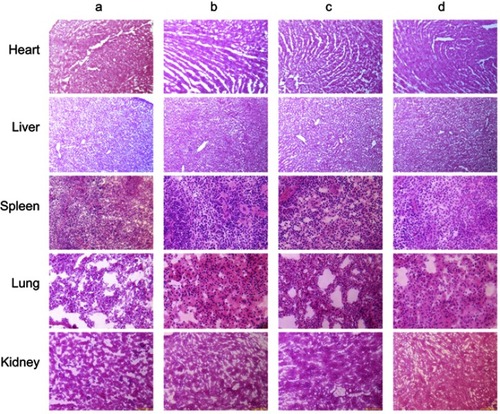
Figure 7 In vivo real-time imaging the distribution of fluorescent probe-labeled functional liposomes in TNBC cancer-bearing mice. (A) In vivo real-time imaging the cancer-bearing mice after intravenous injections. a, physiological saline; b, free DiR; c, regular DiR liposomes; d, functional DiR liposomes. (B) Ex vivo imaging tumor masses and organs after intravenous injections. a, physiological saline; b, free DiR; c, regular DiR liposomes; d, functional DiR liposomes. The results reveal that the functional liposomes have long circulatory circulation in blood system and a higher accumulation in tumor site.
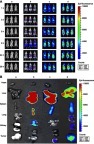
Table S1 The design of miRNA through interactions between the binding sites in the Slug 3ʹ-UTR (top) and miR-203 (bottom)
Table S2 Characterization of functional liposomes
Table S3 Conditions of real-time PCR analysis