Figures & data
Table 1 The small library of NPs used in this work
Figure 1 TEM images of various NPs employed in this work.
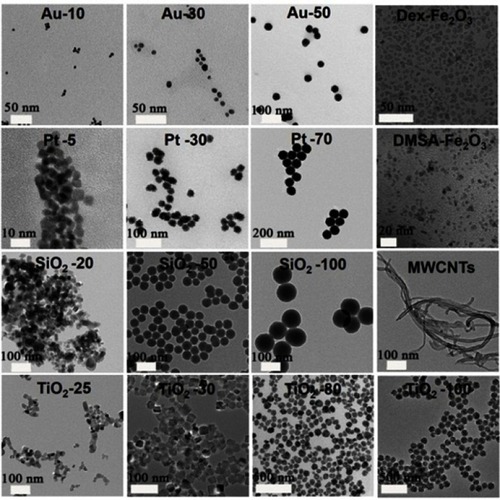
Figure 2 TEM images of cell uptake of various NPs. The NPs were distributed in/beside the cells as the arrow indicated.
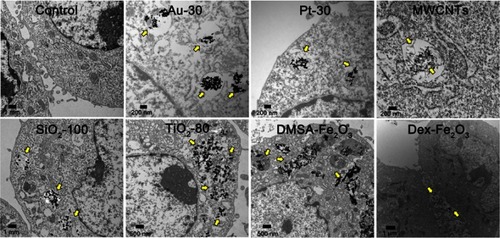
Figure 3 Viability of HUVECs exposed with NPs from CCK-8 assay. The * indicates significant differences between the control group and the nanoparticles treatment group (*: P<0.05, **: P<0.01).
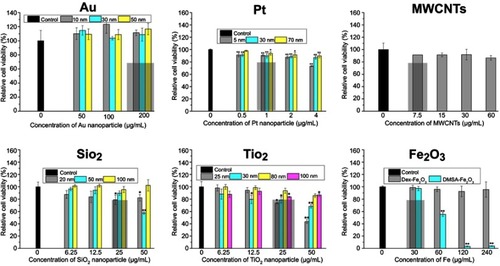
Figure 4 (A) The intracellular ROS level and (B) catalase activity of HUVECs incubated with various NPs. The concentration of NPs in (B) was listed below: Au (50 nm): 200 µg mL−1, Pt (70 nm): 1 µg mL−1, MWCNTs: 7.5 µg mL−1, SiO2 (100 nm): 25 µg mL−1, TiO2 (100 nm): 25 µg mL−1, Dex-Fe2O3: 30 µg Fe mL−1, and DMSA-Fe2O3: 30 µg Fe mL−1. *: P<0.05, **: P<0.01 compared with the control group.
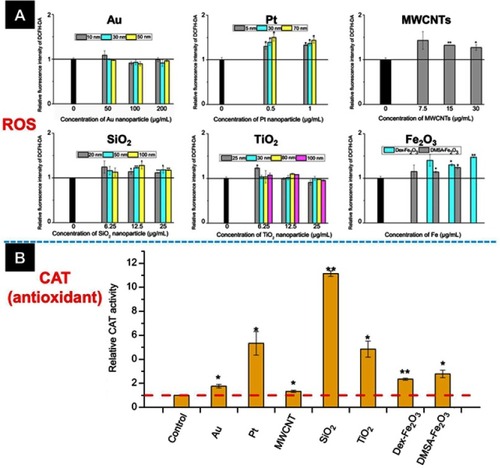
Figure 5 (A) Effects of NPs on the adherens junction of HUVECs were observed from confocal microscope. Scale bar is 20 µm. (B) Western-blot result of VE-cadherin protein expression by endothelial cells incubated with NPs. The concentration of NPs was listed below: Dex-Fe2O3: 120 µg Fe mL−1, DMSA-Fe2O3: 60 µg Fe mL−1, SiO2 (100 nm): 25 µg mL−1, TiO2 (25 nm): 25 µg mL−1, Pt (70 nm): 1 µg mL−1, Au (50 nm): 200 µg mL−1, and MWCNTs: 7.5 µg mL−1. (C) Gap widths between cells treated by NPs which calculated from 10 groups. **: P<0.01 compared with the control group.
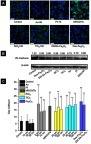
Figure S1 Images of HUVEC in endothelial cell medium from (A) optical microscope, HUVECs were paved stone-like growth and (B) confocal labeled with VE-cadherin antibody (red) and DAPI (blue). Normal umbilical vein endothelial cells connected closely.
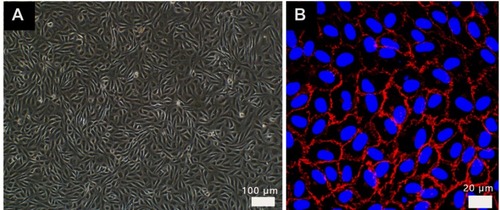
Figure S2 Effects on the adherens junction of HUVEC with various nanoparticles of different size, coating, and concentration. Images are taken from confocal labeled with VE-cadherin antibody (green) and cell nucleus (DAPI, blue). The concentration of various nanoparticles (Au: 200 µg mL−1, Pt: 1 µg mL−1, SiO2: 25 µg mL−1, and TiO2: 25 µg mL−1).
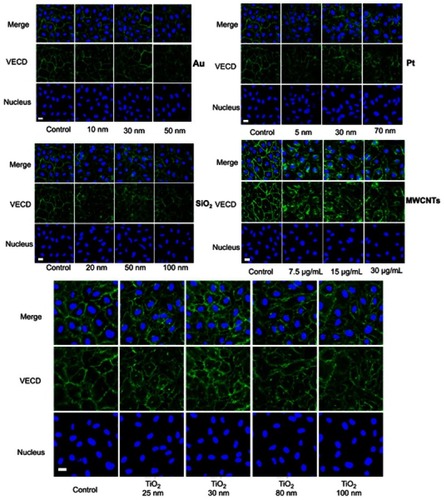
Figure S3 Measurement of gap-width. (A) Gray dots represent the pixel intensity profile of the red line drawn in (B), whereas the black line represents a two-Gaussian fit. The junction width was considered as the width of the fitted curve at 20% above baseline intensity, as indicated by the dashed red line. (B) Images from a confocal microscope. Scale bar is 20 µm.
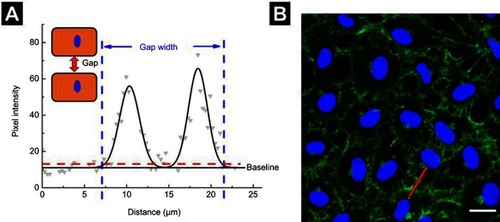
Figure S4 (A) The schematic diagram shows FITC-dextran permeating the collagen layer through a monolayer of endothelial cells. (B) Monolayer permeability was measured in samples that were untreated or treated with NPs for 1 hr. Data were shown as average mean ± SE from five groups of confocal images. (C) The representative YZ confocal cross-section images of the dextran captured in the 2 µg cm−2 collagen, fluorescent images showing nuclei (blue), and FITC-dextran (green) of confluent HUVECs on collagen. The concentration of NPs was following: Au (50 nm): 200 µg mL−1, Pt (70 nm): 1 µg mL−1, MWCNTs: 7.5 µg mL−1, SiO2 (100 nm): 25 µg mL−1, TiO2 (80 nm): 25 µg mL−1, Dex-Fe2O3: 30 µg Fe mL−1, and DMSA-Fe2O3: 30 µg Fe mL−1.
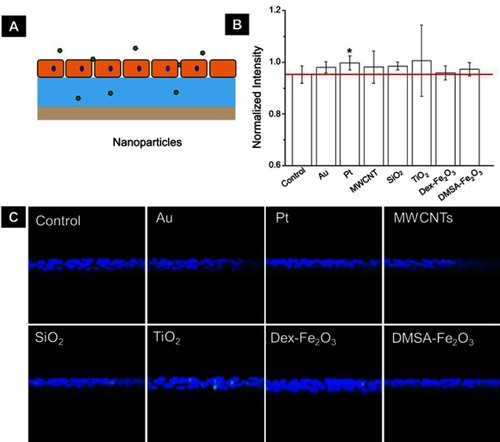
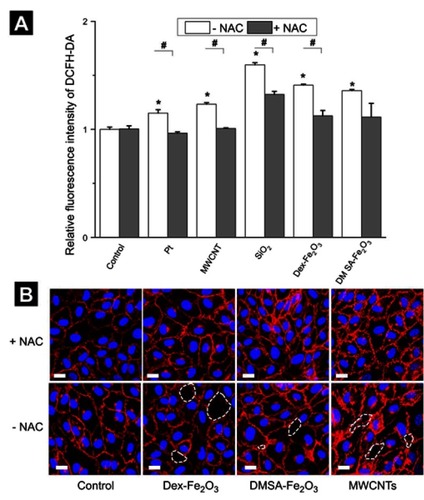
Figure 6 (A) The intracellular ROS level caused by NPs in the absent and present of NAC. The * represents a significant difference comparing with the control group (*: P<0.05), and the # indicates a significant difference between the NAC group and the without NAC pre-treatment group (#: P<0.05). (B) Confocal images in the absent and present of 3 mM NAC. The scale bar is 20 µm for all. The concentration of NPs was following: Pt (70 nm): 1 µg mL−1, MWCNTs: 7.5 µg mL−1, SiO2 (100 nm): 25 µg mL−1, Dex-Fe2O3: 30 µg Fe mL−1, and DMSA-Fe2O3: 30 µg Fe mL−1.