Figures & data
Figure 1 The morphology, structure, and characterization, of OI_NPs. (A) Schematic illustration of the structure of OI_NPs. (B) TEM image of OI_NPs. Scale bar represents 1 µm. (C) SEM image showing that OI_NPs possessed a smooth surface. Scale bar represents 1 µm. (D) The size distribution of OI_NPs, as measured by DLS. (E) The zeta potential of OI_NPs, as determined by DLS measurement.
Abbreviations: ICG, indocyanine green; OXP, oxaliplatin; PFP, perfluoropentane; PLGA, poly (DL-lactide-co-glycolic acid); OI_NPs, ICG, PFP and OXP loaded PLGA nanoparticles; TEM, transmission electron microscope; SEM, scanning electron microscopy, DLS, dynamic light scattering.
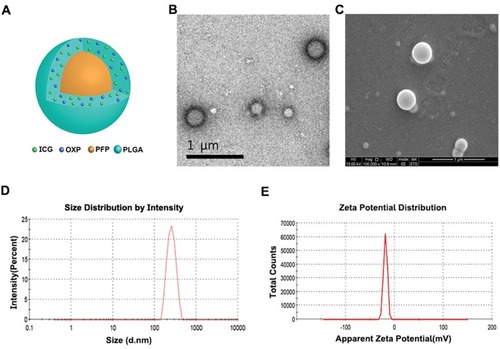
Figure 2 Measurement of the optical properties and stability of OI_NPs. (A) Absorption and (C) fluorescence spectra of free ICG and OI_NPs. (B) The absorbance stability and (D) fluorescence stability of free ICG and OI_NPs at 3-day intervals. These results demonstrated that OI_NPs had a higher stability than freely dissolved ICG.
Abbreviations: ICG, indocyanine green; OI_NPs, indocyanine green, perfluoropentane and oxaliplatin loaded nanoparticles.
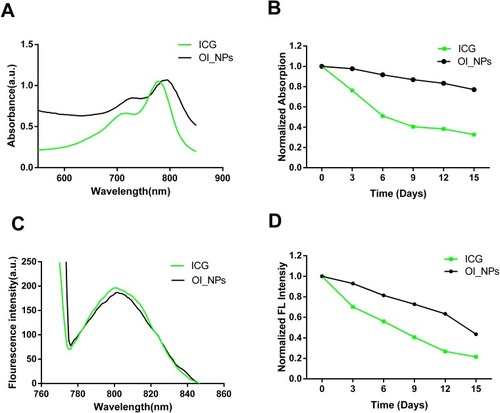
Table 1 The Physicochemical Properties Of Nanoparticles Used In This Study
Figure 3 In vitro ultrasound and photoacoustic imaging of OI_NPs. (A) B-mode and CEUS imaging of different groups before and after irradiation in a phantom gel model. (B) and (C) EI in B-mode and CEUS mode after different treatments. (D) B-Mode and PA -Mode imaging of different groups before and after irradiation. (E) EI in B-Mode and (F) Mean PA. All values represent means ± SD (n=3). The Students’ paired t-test was used to compare data before irradiation and after irradiation. Levels of significance are indicated as *P<0.05; **P<0.01; ***P<0.001.
Abbreviations: NPs, nanoparticles; ICG, indocyanine green; OI_NPs, indocyanine green, perfluoropentane and oxaliplatin loaded nanoparticles; CEUS, contrast-enhanced ultrasound; EI, echo intensity; US, ultrasound; PA, photoacoustic; SD, standard deviation.
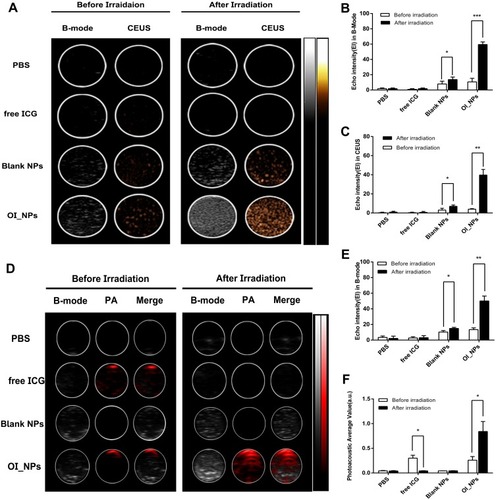
Figure 4 Cellular uptake of OI_NPs by ID8 cells. (A) CLSM images of the subcellular localization of ID8 cells. DAPI (blue) indicates nuclei while DiI (red) indicates OI_NPs. Scale bar represents 25 µm. (B-C) Flow cytometric analysis of mean fluorescence intensity in ID8 cells incubated with media (red) or OI_NPs (blue), for 6 h. Data are shown as means ± SD (n=3). ***P<0.001 versus OI_NPs group.
Abbreviations: DAPI, 2-(4-amidinophenyl)-6-indolecarbamidine dihydrochloride; Dil, 1,1ʹ-dioctadecyl-3,3,3ʹ,3ʹ-tetramethylindocarbocyanine perchlorate; ICG, indocyanine green; OI_NPs, indocyanine green, perfluoropentane and oxaliplatin loaded nanoparticles; CLSM, confocal laser scanning microscopy; SD, standard deviation.
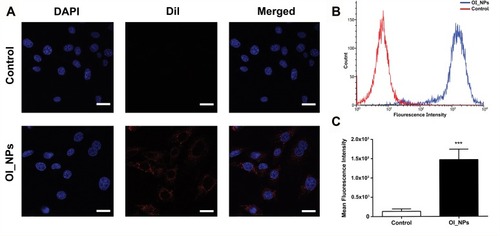
Figure 5 Detection of the viability of ID8 cells by MTT assay. (A) Cytotoxicity of different OXP concentrations, with different formulations, on ID8 cells, as determined by MTT assay. (B) Cell viability of ID8 cells under different treatments, as determined by the MTT assay (6.0µg/mL of OXP and 8.5µg/mL of ICG). Data in (A) and (B) represent the means ± SD of three experiments. Data were analyzed using Student’s t-tests and ANOVA. ***P<0.001 versus control group. ###P<0.001 between groups.
Abbreviations: MTT, 3-(4,5-dimethyl-2-thiazolyl)-2,5-diphenyl-2-H-tetrazolium bromide; ICG, indocyanine green; OXP, oxaliplatin; PFP, perfluoropentane; I_NPs, ICG and PFP loaded nanoparticles; OI_NPs, ICG, PFP and OXP loaded nanoparticles; PSDT, photo–sonodynamic therapy; SD, standard deviation; ns, no significant difference.
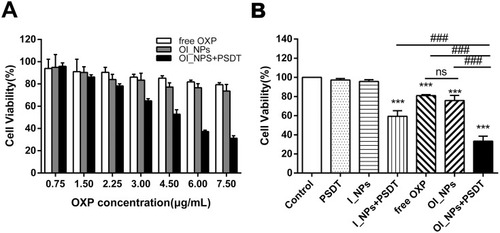
Figure 6 Apoptosis in ID8 cells, as detected by flow cytometry 24 h after different treatments. (A) Control; (B) PSDT; (C) I_NPs; (D) I_NPs + PSDT; (E) free OXP (F) OI_NPs; (G) OI_NPs+PSDT. (H) Statistical results of triplicate experiments. Results are presented as means ± SD. Data were analyzed by the Student’s t-test and ANOVA. Levels of significance are indicated as ***P<0.001 versus control group. #P<0.05 and ###P<0.001 between groups.
Abbreviations: ICG, indocyanine green; OXP, oxaliplatin; PFP, perfluoropentane; I_NPs, ICG and PFP loaded nanoparticles; OI_NPs, ICG, PFP and OXP loaded nanoparticles; PSDT, photo–sonodynamic therapy; SD, standard deviation.
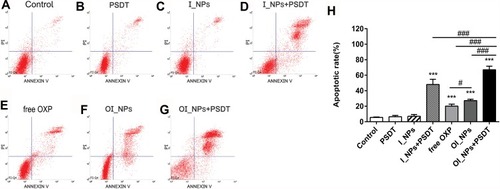
Figure 7 The ability of different treatments to induce CRT exposure and ATP secretion. (A) CRT exposure on the cell surface of ID8 cells was assessed by flow cytometry after different treatments. (B) The amount of released ATP was determined by a Luminometric ATP Assay Kit. Experiments were carried out in triplicate, and the results are presented as means ± SD. Statistical analysis was performed using the Student’s t-test and ANOVA. **P < 0.01 and ***P<0.001 versus control group. #P<0.05,##P<0.01 and ###P<0.001 between groups.
Abbreviations: CRT, calreticulin; ATP, adenosine-5ʹ-triphosphate; ICG, indocyanine green; OXP, oxaliplatin; PFP, perfluoropentane; I_NPs, ICG and PFP loaded nanoparticles; OI_NPs, ICG, PFP and OXP loaded nanoparticles; PSDT, photo–sonodynamic therapy; SD, standard deviation.
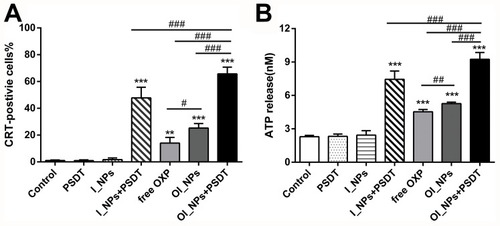
Figure 8 The release of HMGB1 in response to different treatments. (A) Cytosolic HMGB1 (C-HMGB1) was measured using Western blots; β-actin was used as a control. (B) The release of HMGB1 in the supernatant (S-HMGB1) was measured by Western blotting. BSA was used as the control protein. (C) Quantification of the band intensity of C-HMGB1 expression relative to β-actin. (D) Quantification of the band intensity of S-HMGB1 expression relative to BSA. Data in (C) and (D) are presented as means ± SD (n=3). Data were analyzed by Student’s t-tests and ANOVA. *P<0.05, **P<0.01, ***P<0.001 versus control group. #P<0.05 and ###P<0.001 between groups.
Abbreviations: HMGB1, high mobility group box 1; BSA, bovine serum albumin; ICG, indocyanine green; OXP, oxaliplatin; PFP, perfluoropentane ; I_NPs, ICG and PFP loaded nanoparticles; OI_NPs, ICG, PFP and OXP loaded nanoparticles; PSDT, photo–sonodynamic therapy; SD, standard deviation; ns, no significant difference.
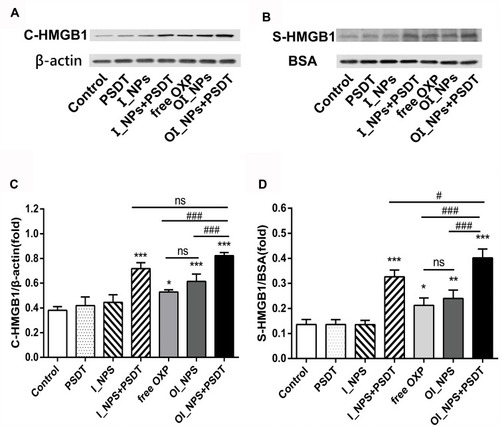
Figure 9 The determination of ROS production and the dependence of CRT on ROS. (A) The green fluorescent signal of DCF for the detection of ROS, as observed under fluorescence microscopy, scale bar represents 50 µm. (B) ROS levels were measured using DCFH-DA. Fluorescence signals were detected with a fluorescence microplate reader. Data are shown as means ± SD (n=3). Statistical analysis was performed using the Student’s t-test and ANOVA. ***P<0.001 versus Control; #P<0.05,##P<0.01,###P<0.001 between groups. (C) A quantitative analysis of CRT surface exposure was performed by using flow cytometry to analyze ID8 cells with and without NAC prior to different treatments. (means ± SD; n= 3 measurements; Student’s t-test; **P<0.01; ***P<0.001).
Abbreviations: CRT, calreticulin; ROS, reactive oxygen species; ICG, indocyanine green; OXP, oxaliplatin; PFP, perfluoropentane; I_NPs, ICG and PFP loaded nanoparticles; OI_NPs, ICG, PFP and OXP loaded nanoparticles; PSDT, photo–sonodynamic therapy; DCF, 2’,7’-dichlorofluorescein; DCFH-DA, 2’,7’-dichlorofluorescin diacetate; NAC, N-acetylcysteine; ns, no significant difference.
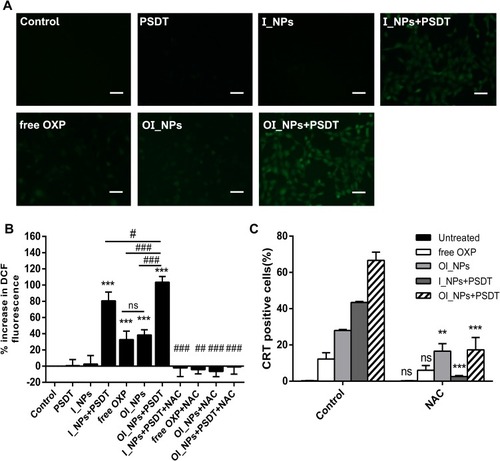
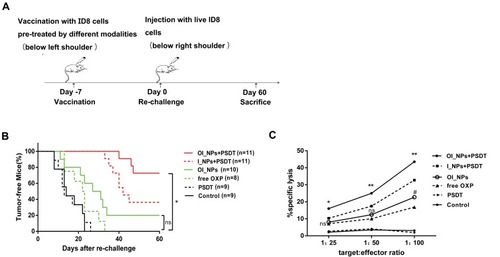
Figure 10 Tumor vaccination was effective against live tumor cells and specific CTL responses to ID8 cells. (A) Schematic illustration of the in vivo experiment used to evaluate the tumor vaccine potential of different modalities. ID8 cells, which had been treated in vitro with different treatments were inoculated subcutaneously into C57BL/6 mice. After 7 day, mice were rechallenged with live ID8 cells (syngeneic to the C57BL/6 mice). (B) The proportion of tumor-free mice is indicated. The Gehan-Breslow-Wilcoxon test was used for Kaplan Meier curves. *P<0.05 versus the OI_NPs+PSDT group; ns denotes no significant difference. (C) Spleen cells isolated from vaccinated mice were collected as effector cells, and ID8 cells used as target tumor cells. Splenocytes and ID8 cells were co-incubated for 4h to detect CTL activity by using a lactate dehydrogenase releasing assay. Data in part C were carried out in triplicate, and the results are presented as means ± SD (n = 3). Data were analyzed by ANOVA and Student's t-test. *P<0.05 and **P<0.01 versus the OI_NPs+PSDT group. OI_NPs group versus free OXP group, #P<0.05.
Abbreviations: ICG, indocyanine green; OXP, oxaliplatin; PFP, perfluoropentane; I_NPs, ICG and PFP loaded nanoparticles; OI_NPs, ICG, PFP and OXP loaded nanoparticles; PSDT, photo–sonodynamic therapy; CTL, Cytotoxic T lymphocyte; ns, no significant difference.